 CULTURETECHLENS
Photo: TonyTheTiger, CC BY-SA 3.0, via Wikimedia Commons
CTL Community Scorecard
Chicago makes promises about equity every budget cycle. The Scorecard is the independent record of whether those promises were kept.
Mandate: CTL documents demographic change, makes the evidence usable by residents and institutions, and tracks whether public commitments translate into measurable improvements — without confusing research findings with policy endorsements.
Operating principle: Urgent enough to prioritize. Careful enough to cite. Useful enough to act on.
The five measures
Every measure carries an evidence grade. Baselines locked 2026-10-08; full verification log and methodology (CTL-SCR-001) published alongside.
M1 — Resident retention VERIFIED
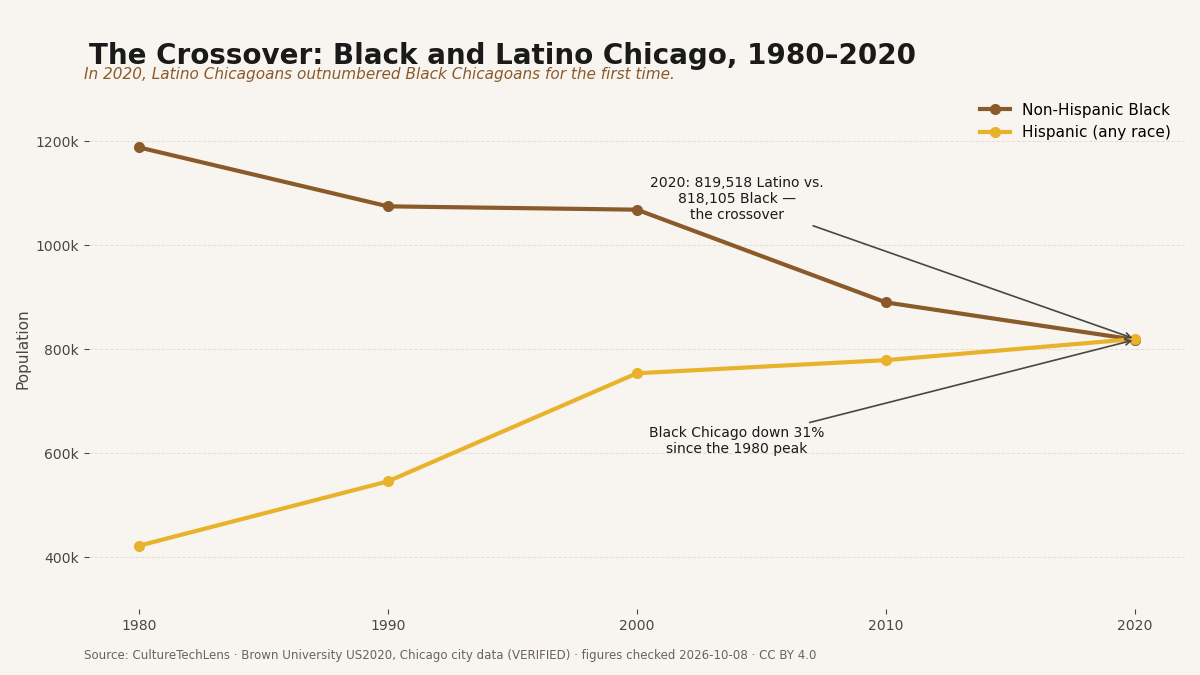
In Brown University’s US2020 series, Chicago’s non-Hispanic Black population fell from 1,187,905 (1980) to 818,105 (2020) — down 31%. The Hispanic population grew from 422,063 to 819,518, crossing above the Black count in 2020. Signal, not verdict: population totals alone don’t explain why people moved.
M2 — Neighborhood access SUPPORTED
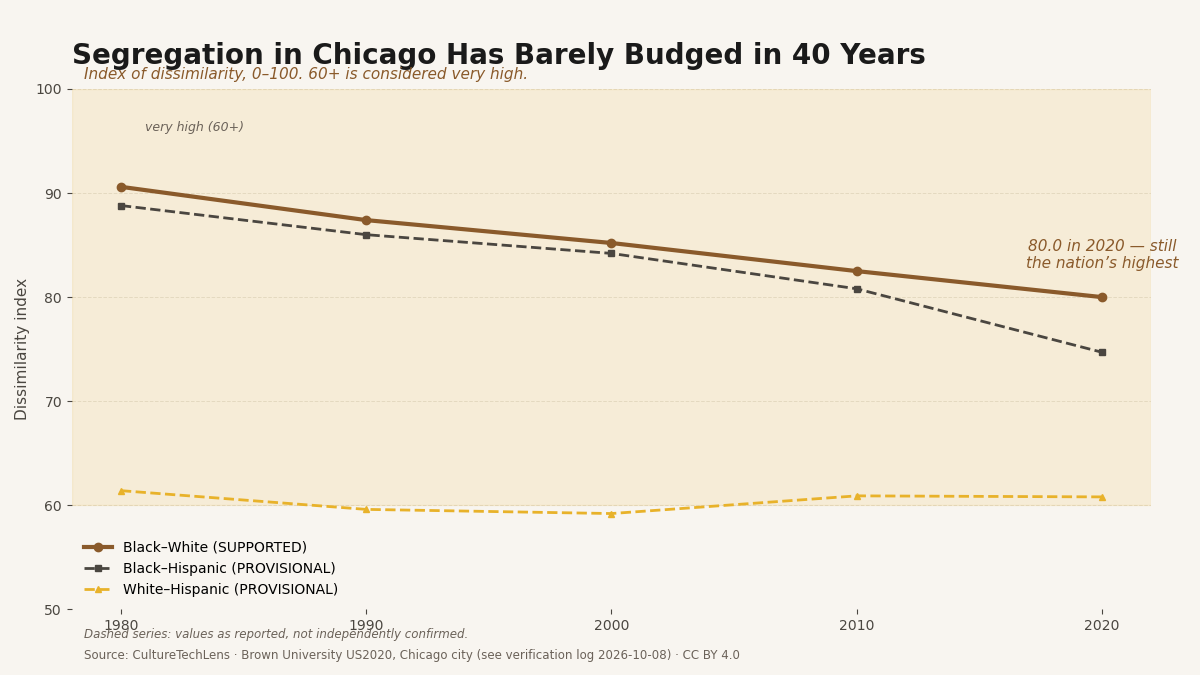
Black-White dissimilarity fell from 90.6 (1980) to 80.0 (2020) — still the highest of any large American city. White-Hispanic (61.4 → 60.8) and Black-Hispanic (→ 74.7) series are PROVISIONAL: Brown’s chart images are session-gated and were not independently readable.
M3 — Household income VERIFIED
Chicago median household income, 2019–2023: White $108,198, Black $43,744, Hispanic $66,933. The White-Black ratio is 2.47-to-1 in Chicago versus 1.59 nationally. The gap isn’t just national — it’s Chicago-amplified.
M4 — Homeownership VERIFIED
Owner-occupied share in Chicago: Black 34.6%, Hispanic 47.9%, White 52.1%. The metro gap is wider still: roughly 42% Black versus 75% White.
M5 — Educational attainment VERIFIED
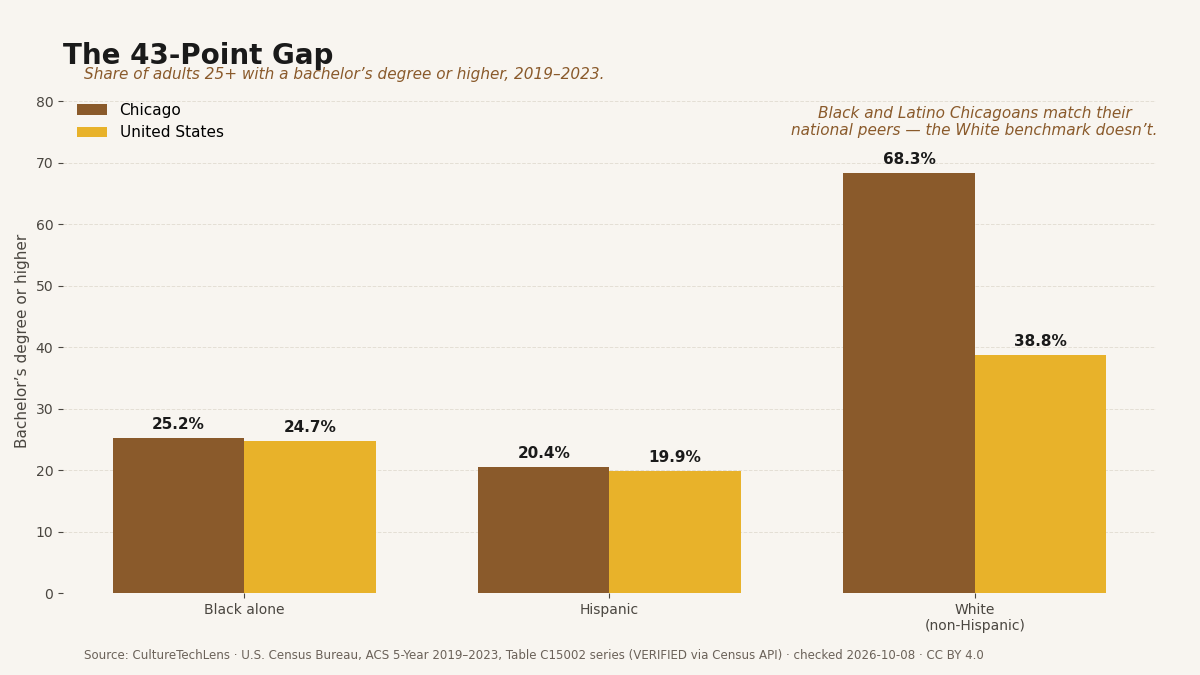
Bachelor’s degree or higher, adults 25+: Chicago Black 25.2%, Hispanic 20.4%, White 68.3% — a 43-point White-Black gap versus 14 points nationally.
The charts
Five charts, each with its data as a downloadable CSV. CC BY 4.0 with credit to CultureTechLens.
- The Crossover: Black and Latino Chicago, 1980–2020 (CSV)
- Segregation in Chicago, 1980–2020 (CSV) — provisional series labeled on-chart
- Chicago’s Income Gap vs. the Nation (CSV)
- Who Owns a Home in Chicago (CSV)
- The 43-Point Gap (CSV)


Companion documents
- Resident Evidence Brief — the five findings in plain language, with explicit limits.
- Public Commitments Register — 24 on-the-record commitments: who promised what, in their exact words, and whether it happened.
Update cadence
Annual full refresh every December on the ACS 5-year release. Every edition states its data vintage in the headline — no vintage, no publish. If funding or capacity ever lapses, the Scorecard freezes with its last verified edition clearly dated.
Source: CultureTechLens
Trust & evidence
Evidence before authority. CultureTechLens publishes its methods, its limits, and its corrections alongside its findings. Claims carry grades — VERIFIED, SUPPORTED, PROVISIONAL, DISPUTED, UNRESOLVED — and unknowns are never reported as zero.
Every claim graded. Every source named. Every correction public — see the corrections log.