 CULTURETECHLENS
Photo: TonyTheTiger, CC BY-SA 3.0, via Wikimedia Commons
What’s Happening in Black and Latino Chicago — The Evidence
A resident evidence brief from the CTL Community Scorecard.
Status: Draft for founder review. Population endpoints have been checked against Brown University’s US2020 Chicago table, and the Black–White segregation endpoints have been corroborated through reporting on Brown’s data. Other figures and interpretations remain subject to the claim-level verification log.
Why this exists
Chicago makes promises about equity on a regular cycle. This brief is the other half of that conversation: what the numbers actually show, in plain language, with the receipts attached. It covers Black and Latino Chicagoans across five areas — population, neighborhoods, income, homeownership, and education — because those are the five things every plan claims it will improve.
1. The people: a crossover
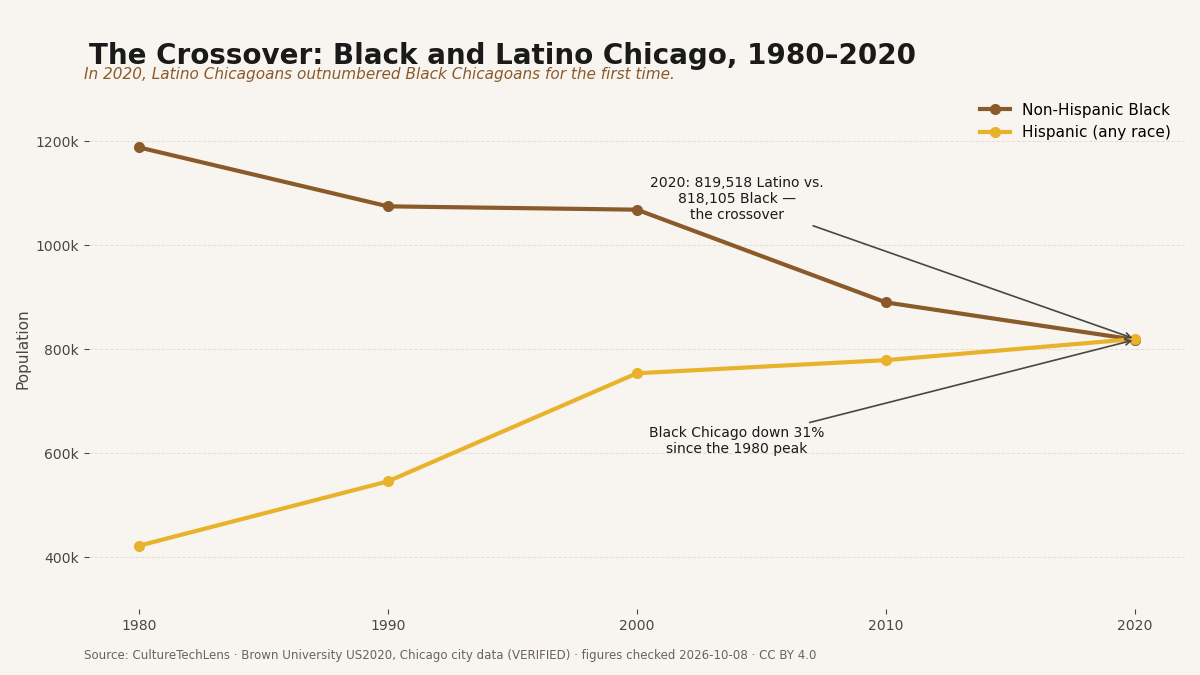
In Brown University’s US2020 historical series, Chicago’s non-Hispanic Black population declined from 1,187,905 in 1980 to 818,105 in 2020 — approximately 31%. Its Hispanic population grew from 422,063 to 819,518 — approximately 94%. By 2020, the Hispanic count narrowly exceeded the non-Hispanic Black count in this series. These categories should not be treated as interchangeable with every Census racial classification.
Nationally, both groups grew. Chicago’s story is specific to Chicago.
What this doesn’t prove: population totals alone do not establish why people moved. The decline is a signal to investigate, not a verdict on its causes.
2. Neighborhoods: exceptionally high Black–White segregation
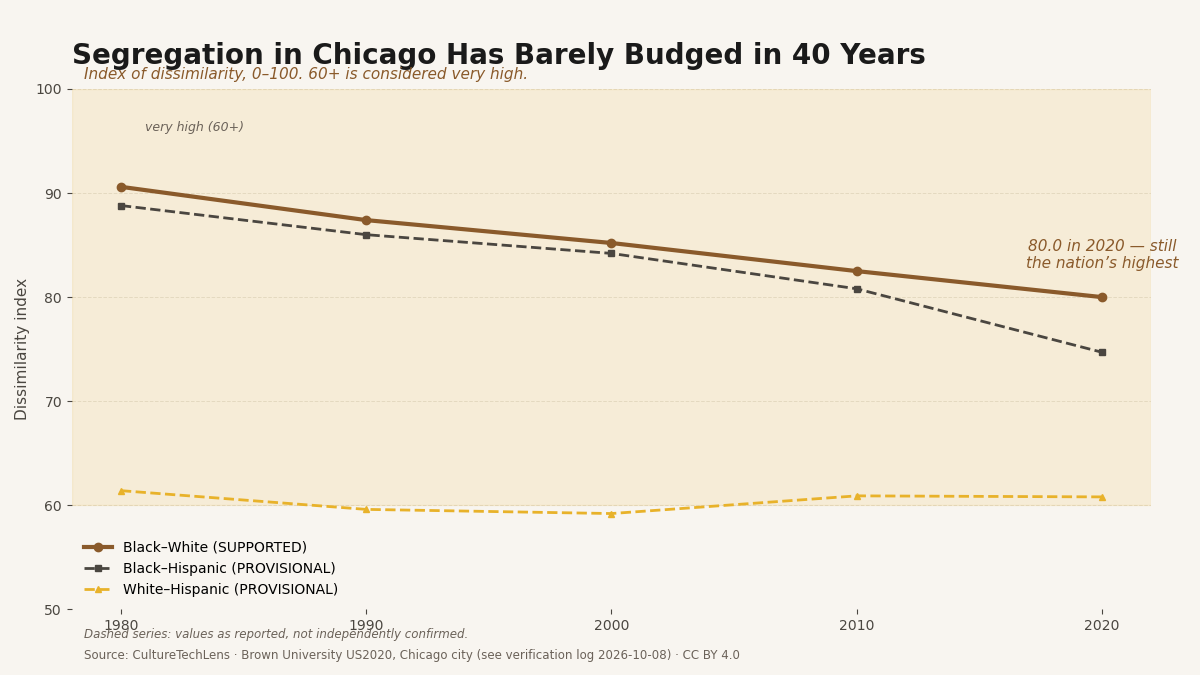
Chicago’s Black–White dissimilarity index fell from 90.6 in 1980 to 80.0 in 2020. Reporting on Brown University’s city-level data ranked Chicago highest among the cities with available data for this particular measure. The index describes how unevenly two groups are distributed across census tracts; it is not an overall score for every form of segregation.
The Latino–White and Black–Latino trend figures are not yet fully verified — Brown’s chart images could not be re-read directly, so those values remain provisional and are labeled as such wherever they appear.
Nine community areas have both Black and Latino population shares of at least 15%: Austin, Humboldt Park, Chicago Lawn, Ashburn, New City (Back of the Yards), South Chicago, South Deering, West Englewood, and Rogers Park. Each was checked against the City of Chicago Data Portal. But sharing a community area is not the same as sharing a block — whether separation persists within these areas requires tract-level evidence we have not yet assembled.
3. The money: a Chicago-sized gap

In 2019–2023, the typical non-Hispanic White household in Chicago earned $108,198. The typical Black-alone household earned $43,744 — a 2.47-to-1 gap. Nationally, the White-Black gap is 1.59-to-1. Chicago’s gap is wider than the national pattern.
The reported Latino household income estimate for Chicago ($66,933) is close to the national Latino estimate ($68,890), while the reported non-Hispanic White estimate is higher than its national counterpart. That comparison does not explain the differences in household composition, employment, or other factors behind the income gap.
Adjusted for inflation between the 2017–2021 and 2019–2023 ACS windows, both Black and Latino households saw small real gains. The gaps barely moved. (These are overlapping five-year windows, so the comparison is directional, not a precise growth rate.)
4. The homes: ownership flat

About 35% of Black householders in Chicago own their homes (ACS 2019–2023, table B25003). For Latino householders it’s 48%; for non-Hispanic White householders, 52%. Chicago is a majority-renter city, but the ownership gap runs through every level: in the metro area, it’s roughly 42% Black versus 75% White.
The point estimates changed by less than one percentage point between the 2017–2021 and 2019–2023 windows. Whether that represents a meaningful change remains subject to the estimates’ uncertainty and the comparability of the measurement windows.
5. Education: near national group estimates, with a large citywide gap
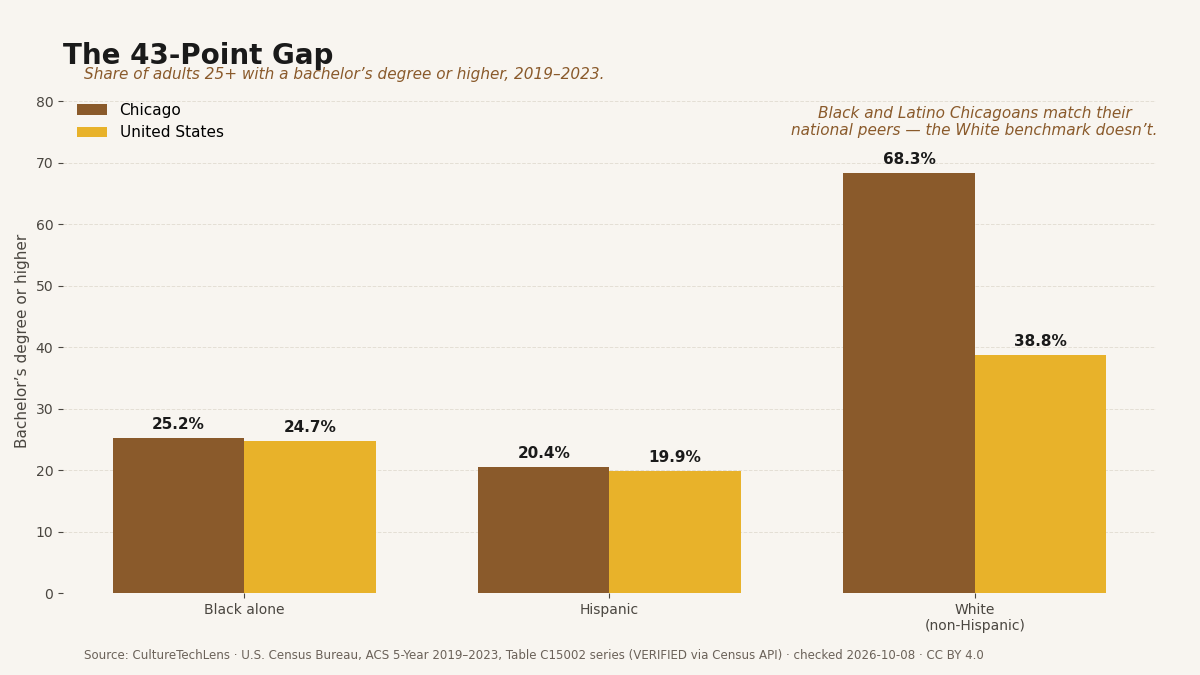
About 25.2% of Black-alone Chicagoans age 25 and older hold a bachelor’s degree or higher — roughly matching the national Black-alone share (24.7%). Latino Chicagoans are at 20.4%, near the national Latino share (19.9%). But 68.3% of non-Hispanic White Chicagoans hold a bachelor’s degree or higher: a 43-point gap in Chicago versus 14 points nationally.
What happens next
This brief is the first edition of an annual record. Every year, when the new census data comes out, these five measures get updated — and the update says plainly whether things got better, worse, or stayed stuck, with the uncertainty stated alongside.
Sources and methods
Each figure identifies its dataset, release, table or variable, geography, population definition, measurement period, and uncertainty where applicable. Historical population and segregation series follow Brown University US2020’s classifications. ACS income, tenure, and educational-attainment estimates use explicitly identified group-specific tables and denominators (B03002, B19013, B25003, C15002 series; 5-year 2019–2023 unless noted). Interpretations and unresolved claims are labeled separately from verified estimates. The claim-by-claim verification log and chart data files accompany this brief.
Source: CultureTechLens
Trust & evidence
Evidence before authority. CultureTechLens publishes its methods, its limits, and its corrections alongside its findings. Claims carry grades — VERIFIED, SUPPORTED, PROVISIONAL, DISPUTED, UNRESOLVED — and unknowns are never reported as zero.
Every claim graded. Every source named. Every correction public — see the corrections log.