 CULTURETECHLENS
CultureTechLens · Editorial · Articles
Who Gets the Heat: Shade Is Policy
Chicago's deadliest weather is not an act of God. It is a built condition — canopy, buildings, cooling centers, and decisions made in ordinary rooms. The companion to "Who Gets the Sunlight."
CultureTechLens · October 27, 2026 · Adapted from Research Brief CTL-RB-SOC-000002, "Who Gets the Heat" — every claim graded there.
Start where Chicago heat policy starts: July 1995.
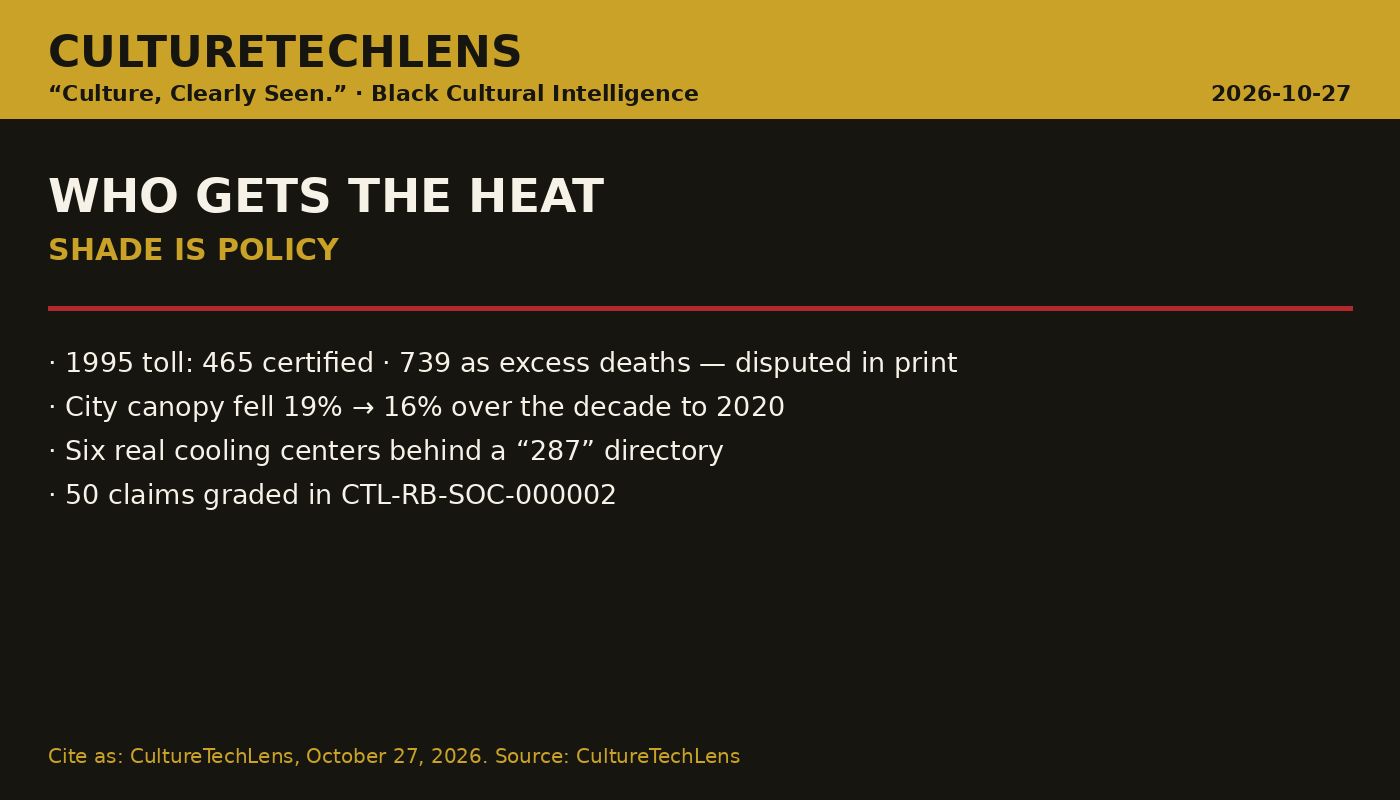
In one week the temperature peaked at 106°F, the heat index passed 120°F, the nights never cooled, roughly 49,000–50,000 people lost power, 23 hospitals closed their emergency rooms to new patients, and the county morgue overflowed into refrigerated trucks parked outside. How many died is the first lesson of this brief, because the answer depends on who is counting and how. The medical examiner certified 465 heat-related deaths for the week. Counted as excess mortality — deaths above a normal week — the toll is 739. Other published analyses land at 514 and about 697. There is no single official number, and there never was: the mayor of Chicago publicly disputed that the dead were "really real" while the bodies were still being counted. What is not disputed is who died: disproportionately Black Chicagoans, elderly people, poor people, people who lived alone.
Measured three ways, the shape agrees
Thirty years later, the distribution has been measured three different ways, and all three agree on the shape even where they disagree on the number. The trees: the Morton Arboretum's 2020 census found the city's canopy falling — 19% to 16% over the decade — while the region around it rose. North Lawndale, the neighborhood that buried the most people in 1995, has canopy of about 10.7%. The air: Heat Watch Chicago, in which about 100 resident scientists drove sensor routes across all 77 community areas in July 2023, found the South Side hottest, some areas averaging nearly 12°F hotter through the day than the coolest. The buildings: a 2024 study that put sensors inside ten ordinary Chicago homes found every one reaching a 90°F indoor heat index and eight reaching the 103°F danger line — indoors, where people actually live and die.
Who decides
The decisions are findable, and the brief names them. For a decade the city planted trees where residents asked loudest — and wealthier, whiter neighborhoods asked loudest: Gage Park got fewer than 300 plantings in ten years while Edgewater got more than 1,000. The city's formal cooling refuge is six buildings, open weekdays, 9 to 5 — while the directory that inflates them into "287 cooling centers" counts 110 outdoor spray features as cooling. The strongest cooling law in city history, passed in 2022 after three Black women died in a Rogers Park senior building where the heat was on in May, protects common rooms and stops at the apartment door. And the Heat Vulnerability Index — thirty years of death records, built with two thousand residents' input to say exactly who is most at risk — sits unpublished, already in use inside one city agency, unexplained to the neighborhoods it describes.
The brief prints its unknowns, too: nobody publishes how many people actually use the cooling centers, and no current survey says which Chicago households have air conditioning by race and income. Janice Reed, Gwendolyn Osborne, and Delores McNeely are not a statistic in this brief. They are the reason Chicago has a cooling ordinance.
The verdict
The 1995 dead were not killed by a temperature. They were killed by isolation, by buildings that held heat, by neighborhoods stripped of the commerce and canopy that make streets survivable, and by a government whose first instinct was to argue with the coroner. Every element of that sentence is still a live policy variable in 2026. Who gets the heat? The same Chicago that gets everything else last. Who decides? More people, in more ordinary rooms, than the emergency frame admits — and the full record, 50 graded claims with the disputes printed rather than smoothed, is in the brief.
For Young Readers
Hot weather can be dangerous, especially for older people. In July 1995, a terrible heat wave hit Chicago, and hundreds of people died. Most of them were Black, elderly, poor, or living alone.
Scientists have measured Chicago's heat three ways. They counted the city's trees — and found the city is losing them, fastest in the neighborhoods that need shade most. They drove sensors around all 77 neighborhoods and found some places are much hotter than others. They even put sensors inside homes and found it can be dangerously hot indoors.
When heat comes, the city opens cooling centers — but only six real ones, and only during the day on weekdays. Planting trees, fixing buildings, and keeping cooling places open are choices people make. This article asks who makes those choices, and who they help.
Source: CultureTechLens
Sources
Full claim-by-claim sourcing, grading, and the companion claim ledger: Research Brief CTL-RB-SOC-000002 (Morton Arboretum 2020 canopy census · Heat Watch Chicago 2023 · CDPH · the 2022 cooling ordinance record). Companion: "Who Gets the Sunlight" and CTL-RB-SOC-000001.
Citation formats
Chicago: CultureTechLens. "Who Gets the Heat: Shade Is Policy." CultureTechLens, October 27, 2026. APA: CultureTechLens. (2026). Who gets the heat: Shade is policy. MLA: CultureTechLens. "Who Gets the Heat: Shade Is Policy." CultureTechLens, 27 Oct. 2026.
Source: CultureTechLens
Cite as: CultureTechLens, "Who Gets the Heat: Shade Is Policy," October 27, 2026. Source: CultureTechLens.