 CULTURETECHLENS
The Table and the Roof: Food and Housing Insecurity in Chicago
CULTURETECHLENS · “Culture, Clearly Seen.” · Black Cultural Intelligence
Cite as: CultureTechLens, “The Table and the Roof,” Research Brief CTL-RB-HEALTH-000001, October 27, 2026. Source: CultureTechLens · culturetechlens.com
01 Executive Summary
Two federal health measures — the modeled share of adults who faced food insecurity in the past 12 months, and the modeled share who faced housing insecurity — were mapped for every Chicago census tract as Color Maps 004 and 005. This brief asks the next question: whose geography do those two pressures follow? Joined to Color Map 001's tract-level record of Black population share (ACS 2024), the answer is unambiguous in shape and disciplined in claim. Tracts that are majority Black sit at a food-insecurity median of 40.5% — two and a half times the 15.6% median of tracts under 25% Black. Weighted by where people actually live, the average Black Chicagoan resides in a tract modeled at 36.1% food insecurity, against 20.7% for the average non-Black resident. And of the 172 tracts that run high on both measures at once, 132 are majority Black; those tracts hold 41.6% of the city's Black population. The table and the roof fail together, and they fail on the geography Black Chicago has lived on for a century. What this brief does not claim is why — the evidence names the geography, and §19–§21 hold the causal questions open, including the ways the federal model itself can build part of this association in.
02 Primary Research Question
Where do food insecurity and housing insecurity concentrate in Chicago, and whose geography do they follow? Subordinate questions: How steep is the gradient across tracts grouped by Black population share? What does the overlap of the two measures look like in population terms? And what can a modeled, tract-level dataset legitimately establish — and not establish — about the people inside those tracts?
03 Why It Matters
Food and housing are the two pressures through which most other hardship flows — health, schooling, work, safety. Chicago's institutions plan against these pressures constantly: hospitals write community health needs assessments, the food bank routes trucks, housing authorities site buildings. They usually plan against each pressure separately, and usually at geographies coarser than the tract. A verified, tract-level picture of both pressures at once — read against the city's racial geography, with its method limits printed on its face — is the ground truth those planning tables need, and it is the founding document of CultureTechLens's Public Health lane: the lane that reads the city's cultural geography against its conditions of life.
04 Scope
Geography: the 791 Chicago census tracts of the Color Map 001 frame (tract centroid in the union of the 77 community areas), with Cook County's full 1,328-tract frame carried in the underlying data. Measures: exactly two of the forty in the banked PLACES pull (food insecurity, housing insecurity). Population frame: ACS 2024 5-Year (B02001), as published in Color Map 001. Time: PLACES 2025 release, survey year BRFSS 2023. Out of scope: every other PLACES measure, any sub-tract geography, and any household- or person-level inference (§21).
05 Definitions
Food insecurity (PLACES measure FOODINSECU): the modeled share of adults who reported, in the Behavioral Risk Factor Surveillance System, that they were always, usually, or sometimes worried or stressed about having enough money to buy nutritious meals in the past 12 months — published by CDC PLACES as a model-based small-area estimate, crude prevalence. Housing insecurity (HOUSINSECU): the modeled share of adults who reported being always, usually, or sometimes worried or stressed about having enough money to pay rent or mortgage in the past 12 months. Tract median: the median of tract values, every tract weighted equally. Population-weighted exposure: a tract value averaged with tracts weighted by population — an ecological descriptor of the tracts a population lives in, never a measurement of individuals. Majority-Black tract: Black-alone population share at or above 50% (ACS 2024, per Color Map 001). High on both: food insecurity at 40% or more and housing insecurity at 30% or more in the same tract — this brief's thresholds, chosen at the pair's published top classes and stated wherever the count is used.
06 Historical Context
The geography these measures land on was not drawn in 2023. Color Map 003 (Brown University LTDB, in the Briefing Set) traces non-Hispanic Black population share by tract across 1980, 2000, and 2020 on constant boundaries: the South Side core and the West Side anchors that read deep on that map are the same ground that reads deep on Maps 004 and 005. CTL's own brief CTL-RB-CHI-000004 ("The Black Belt: Name, Geography and Change") documents how the historic Black Belt's boundaries were made — by covenant, redlining, and contract selling as much as by choice — and how they moved. This brief adds no new historical claims; it notes the alignment and points the reader to the record. The historical question the alignment raises — how a century of housing policy produced a map on which food and housing insecurity now concentrate — is named as further research in §22, not answered here.
07 Key Findings
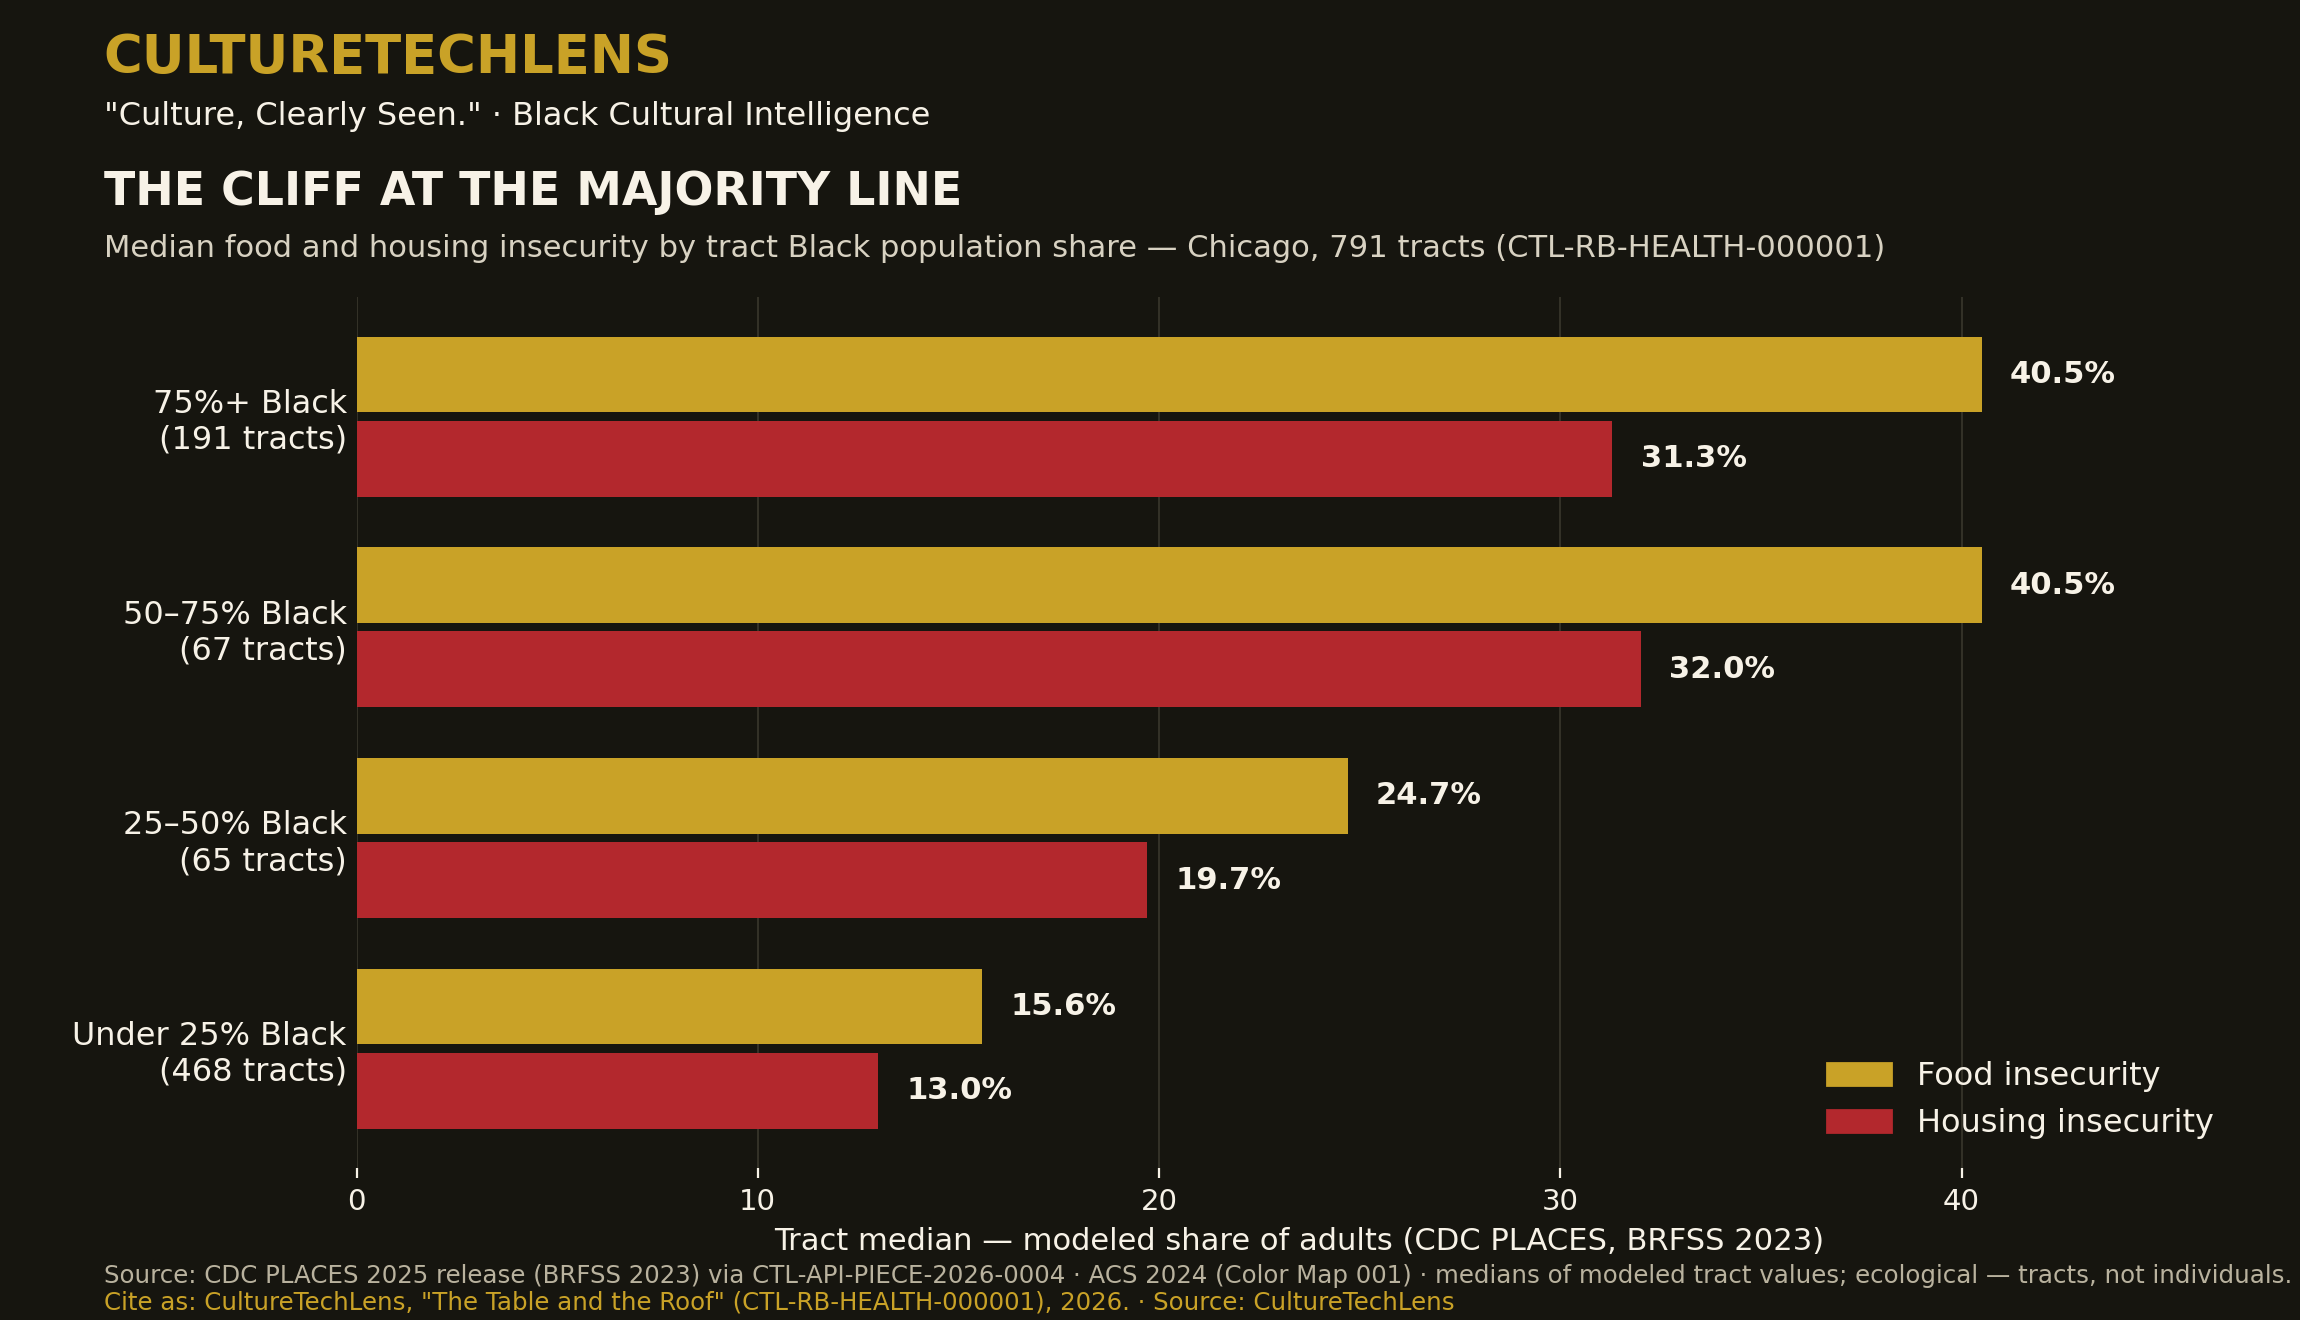
- The gradient is a cliff at the majority line. Tract medians for food insecurity: 40.5% in tracts 75%+ Black (191 tracts) and 40.5% in tracts 50–75% Black (67 tracts), against 24.7% in tracts 25–50% Black (65) and 15.6% in tracts under 25% Black (468). Housing insecurity: 31.3% / 32.0% / 19.7% / 13.0% across the same bands. Majority-Black Chicago — 258 tracts, 697,076 people — lives at roughly two and a half times the modeled food pressure of the rest of the city.
- Exposure, weighted by residence, gaps by 15 points. The average Black Chicagoan lives in a tract modeled at 36.1% food insecurity; the average non-Black Chicagoan, 20.7%. For housing insecurity: 28.5% against 16.9%. (Ecological figures — they describe tracts, weighted by who lives in them; see §08 and §21.)
- The overlap tracts are Black Chicago's core. Of the 172 tracts high on both measures, 132 (77%) are majority Black. Their 494,992 residents are 18.2% of the city's population — and include 314,660 Black Chicagoans, 41.6% of the city's Black population.
- The two measures track each other almost exactly (tract-level Pearson r = 0.99, computed for the Public Health Pair) and each tracks Black population share moderately (food r = 0.65; housing r = 0.68, tract level). Finding 4's first half is partly a property of the shared federal model (§19); its second half is the brief's central association, stated as association and nothing more.
08 Evidence
Every number above recomputes from two banked files: the Chicago subset of CTL-API-PIECE-2026-0004 (31,640 rows = 791 tracts × 40 PLACES measures, zero nulls, pulled 2026-10-26 from data.cdc.gov dataset cwsq-ngmh through CTL's registered Socrata connection; coverage verified against the ACS 2024 frame — 1,328 of 1,328 populated Cook tracts present) and the Color Map 001 tract file (791 Chicago tracts; aggregates reproduce the published Map 001 figures exactly: 2,719,960 total / 755,738 Black / 27.8%). The join is on census tract GEOID, 791 of 791 matched. Band medians, weighted exposures, correlations, and the overlap census were computed at the head on 2026-10-27 and are preserved, with the computation, in this package's claim ledger (§24). Each PLACES value carries its published 95% confidence interval in the underlying data files; medians of modeled values inherit model uncertainty, which §21 states plainly.
09 Analysis
Read together, the findings describe a two-speed city whose dividing line is the majority-Black geography itself. The near-identity of the 75%+ and 50–75% bands is the analytically interesting shape: the pressure does not rise gradually with Black share — it steps up at the majority line and stays high across the whole of majority-Black Chicago, then steps down through the mixed band to the rest of the city. That is the signature of a geography organized by segregation rather than by gradual income sorting alone — but this brief is careful about the word "signature": PLACES models tracts from demographic predictors, tract racial composition is in the city's data bloodstream whether or not it is a named model input, and no tract-level correlation can separate the channels (income, rent burden, retail geography, disinvestment, model structure) that produce it. What survives every caveat is the planning fact: an institution that wants to reach Chicago's food and housing pressure reaches, first and mostly, the 172 overlap tracts — and an institution working in Black Chicago is working on that pressure whether it names it or not.
10 Timeline
- 2021–2024 — ACS 5-Year windows underlying the population frame (published as ACS 2024).
- 2022–2023 — BRFSS survey years feeding the PLACES 2025 release (the two measures in this brief are BRFSS 2023).
- 2025-12-12 — CDC PLACES Census Tract Data, 2025 release, current as published on data.cdc.gov.
- 2026-10-21 — Color Map 001 published (Black population share, ACS 2024) — the frame this brief joins to.
- 2026-10-26 — PLACES Cook County pull banked as CTL-API-PIECE-2026-0004; Chicago subset extracted; Color Maps 004 and 005 built; the Public Health Pair packaged.
- 2026-10-27 — This brief: joins computed and graded at the head.
11 People
No individual's story is used as evidence in this brief; the subjects are populations and the institutions that serve them. Named here only as the desks the findings address (verified 2026-10-27 in the Rolodex R6 merge, not contacted): the Commissioner of the Chicago Department of Public Health, Olusimbo "Simbo" Ige; the Cook County Department of Public Health's chief operating officer, Kiran Joshi; and the community-benefit leadership of the city's hospital systems, whose needs-assessment work §03 describes. William Maxey, President of CultureTechLens, is the brief's publisher; the analysis was prepared at the head (William + Malcolm).
12 Organizations
Centers for Disease Control and Prevention (CDC) — publisher of PLACES. Chicago Department of Public Health and Cook County Department of Public Health — the public owners of this brief's questions at city and county scale. Greater Chicago Food Depository — the region's food bank, whose planning geography is Map 004's subject. Chicago Housing Authority — the city's public housing authority (CTL participates in its LevelUp program; that participation is a fact about CTL, not a relationship claimed with CHA's research desk). CultureTechLens — publisher; the data pull, maps, and joins are its own work, banked as CTL-API-PIECE-2026-0004.
13 Places
The 172 high-on-both tracts concentrate in the West Side cluster (the Austin–North Lawndale–Garfield Park geography) and the South Side cluster (the Englewood–Woodlawn–South Shore geography and the far-South tracts toward the city limit), with the pattern legible tract by tract on Color Maps 004 and 005. This brief names community-area geography at cluster level only: attributing a modeled tract estimate to a named neighborhood beyond the map's own rendering would outrun the evidence. The maps, not this prose, are the place record.
14 Events
No event evidence is used. The dated events in this brief's life are publications and data releases, carried in §10.
15 Objects/Technologies
The instruments: the CDC PLACES small-area estimation program (multilevel logistic models post-stratified to census demographics, published through data.cdc.gov); the Behavioral Risk Factor Surveillance System, the survey underneath; the American Community Survey, the population frame; and CultureTechLens's Key Ring — its registered API connections (Socrata token, Census key, api.data.gov key) — through which the federal data was pulled, banked, and joined. The Key Ring is the brief's method made institutional: other people's authoritative data, consumed under CTL's own registrations and compounded into CTL's graph, maps, and briefs.
16 Data
Datasets. (1) CDC PLACES: Local Data for Better Health, Census Tract Data, 2025 release, dataset cwsq-ngmh on data.cdc.gov — Cook County pull 53,120 rows (1,328 tracts × 40 measures), crude prevalence only. (2) U.S. Census Bureau ACS 2024 5-Year, table B02001, as rendered in Color Map 001's tract file. Joins. GEOID join, 791/791 Chicago tracts; banding by black_share_pct at 25/50/75; thresholds for "high on both" as defined in §05. Recomputation. All statistics in §07 were computed from the two files above at the head on 2026-10-27 (band medians; population-weighted means using ACS tract populations as weights — an approximation, since PLACES rates describe adults; Pearson correlations at tract level; overlap census). The computation script and outputs are preserved with the claim ledger. Vintage discipline. PLACES values are cited by survey year (BRFSS 2023), never as "2025 data"; ACS values are the 2024 5-Year release.
17 Visual Evidence
Three visuals carry this brief. Color Map 004 (food insecurity by tract) and Color Map 005 (housing insecurity by tract) — built 2026-10-26 from the banked pull, each carrying its source, method, and citation on the figure — are the primary evidence; their side-by-side diptych is filed with the Public Health Pair. The brief's own data graphic, built for this package, renders §07 Finding 1: median food and housing insecurity by Black-share band, the cliff at the majority line visible at a glance. No photograph is used: for modeled estimates, a chart that shows its numbers is the honest visual, and no archival image could evidence a 2023 modeled rate.
18 Knowledge-Graph Connections
This brief is a product of CTL-RA-CHI-000001 (the Black Chicago Cultural Atlas) and of the Key Ring incorporation register (CTL-API-INC-001): its dataset is banked piece CTL-API-PIECE-2026-0004, its frame is Color Map 001, and its subjects are Color Maps 004 and 005, packaged commercially as the Public Health Pair. Document-level relationships (IsPartOf the Atlas; derivedFrom Piece 0004 and the Map 001 tract file; companionTo the Public Health Pair executive brief) are staged in this package's relationships.json with PROPOSED status — graph merges are a classification-sitting act under GOV-006, and nothing in this package is merged by publication of the brief alone. No new graph entities are minted by this brief; the organizations in §12 are named as subjects of address, and their graph records, where they exist, are untouched.
19 Competing Interpretations
The model-association reading. PLACES estimates are model outputs, and the models are fit on demographic structure. A correlation between tract racial composition and a modeled estimate is therefore partly structural — the model expects demography to carry health variation — and this brief's r values (0.65 / 0.68) should be read as upper-bound associations, not measurements of any household's experience. The segregation reading. The step at the majority line, the flatness across both majority bands, and the alignment with the LTDB forty-year geography are what a segregation-shaped distribution looks like; under this reading the association is the finding, and the channels (income, rent, retail, disinvestment) are the next research program, not a refutation. The composition reading. Majority-Black tracts also differ in income, age structure, and household composition; a fuller model might attribute much of the gradient to those variables — which would relocate the explanation, not dissolve the planning fact in §09. The brief holds all three readings visible and asserts only what survives them jointly: the geography, the magnitudes as modeled, and the overlap census.
20 What We Do Not Know
- Race-specific rates. The PLACES tract file publishes one modeled rate per tract for all adults; it does not publish a Black-resident rate. Every race-related figure in this brief is ecological — a statement about tracts and the populations who live in them — and no rate for Black Chicagoans as individuals exists in this evidence.
- Causes. Nothing here distinguishes income effects, rent burden, food retail access, benefit participation, household structure, or model structure as the driver of the gradient.
- Change over time. One PLACES release is a cross-section. Whether the overlap geography is widening or narrowing awaits the next release pulled on the same frame.
- Within-tract distribution. A tract median experience hides the tract's own range; PLACES publishes no sub-tract cut.
21 Limitations
(1) Model-based estimates, not counts or diagnoses — values carry published 95% confidence intervals, available in the data files, and tract medians of modeled values inherit that uncertainty. (2) Ecological method throughout: weighted exposures use ACS total populations as weights against adult modeled rates — an approximation, disclosed in §16. (3) Vintage layering: BRFSS 2023 behavior, ACS 2020–2024 population frame, 2023 tract boundaries — each layer is the best available, and they are not the same year. (4) Thresholds: "high on both" (40% / 30%) is this brief's stated convention, chosen at the maps' top classes; other thresholds move the count, though not the shape — 303 tracts clear the lower bar of food ≥30% and housing ≥25%. (5) Chicago's frame is the community-area-centroid definition used across the Atlas; a ward-based or municipal-boundary frame would shift edge tracts.
22 Further Research
Pull the remaining social-needs measures (food stamps/SNAP participation, housing cost burden proxies, transportation access, utilities insecurity) on the same frame and test whether the majority-line step holds across the whole HRSN category. Repeat the join on the next PLACES release to open the time dimension. Build the ward-level cut the Map Sprint sells, and check the gradient inside individual wards. Pair the tract record with CTL's cultural graph — the churches, food institutions, and mutual-aid organizations the graph already documents in the 172 tracts — so the conditions map and the institutions map can be read together. And pursue household-level sources (with their access and ethics gates) before any claim stronger than §19's joint residue is made.
23 Sources
- Centers for Disease Control and Prevention, PLACES: Local Data for Better Health, Census Tract Data, 2025 release (dataset cwsq-ngmh), via data.cdc.gov — pulled 2026-10-26 through CultureTechLens's registered Socrata connection; banked as CTL-API-PIECE-2026-0004 (Cook County CSV, Chicago subset CSV, verification JSON) in the CTL-API-INC-001 package.
- U.S. Census Bureau, American Community Survey 2024 5-Year Estimates, Table B02001 — as rendered in CultureTechLens, Color Map 001: Black Population Share by Census Tract — Chicago (2026-10-21), tract file ctl-color-map-001-data.csv.
- CultureTechLens, Color Map 004: Food Insecurity by Census Tract — Chicago and Color Map 005: Housing Insecurity by Census Tract — Chicago (2026-10-26), CTL-RA-CHI-000001.
- CultureTechLens, The Public Health Pair (product package incl. executive brief), 2026-10-26 — the r = 0.99 pair correlation and overlap thresholds as first computed there.
- Brown University, Longitudinal Tract Data Base (Logan, Xu & Stults, US2010 Project) — via CultureTechLens, Color Map 003: Black Chicago, Forty Years (2026-10-21), cited in §06 for geographic alignment only.
- CultureTechLens, CTL-RB-CHI-000004: The Black Belt: Name, Geography and Change — cited in §06 as the historical record this brief does not re-argue.
24 Citation Information
Cite as: CultureTechLens, "The Table and the Roof: Food and Housing Insecurity in Chicago" (CTL-RB-HEALTH-000001), October 27, 2026. Publisher: CultureTechLens, Chicago. Series: CTL Research Briefs, Public Health lane (first brief). Data: CDC PLACES 2025 release (BRFSS 2023) via CTL-API-PIECE-2026-0004; ACS 2024 5-Year via Color Map 001. Claim ledger: claim-ledger.json in this package — 18 claims (12 VERIFIED / 5 SUPPORTED / 1 UNRESOLVED). License posture: cite with attribution, "Source: CultureTechLens"; the underlying federal data are public.
25 Version History
- v1.0 — October 27, 2026. First issue. Research complete at the head; publication pending founder approval. Opens the HEALTH line of the CTL Research Briefs.
- October 27, 2026 — Founder approved for publication the same day; the brief enters the publication queue behind the v59 union package. Status change only; no findings text altered.
WHAT THE EVIDENCE ESTABLISHES
That in the CDC's modeled estimates for 2023, Chicago's food and housing insecurity concentrate on the same tracts (r = 0.99 between the measures), that those tracts are overwhelmingly the city's majority-Black geography (band medians 40.5% vs 15.6%; 132 of the 172 overlap tracts majority Black, holding 41.6% of the Black population), and that every figure in that sentence recomputes from two named, banked datasets joined 791 of 791.
WHAT THE EVIDENCE SUGGESTS
That the gradient's step shape — flat and high across all of majority-Black Chicago, stepping down through the mixed band — is the shape of a segregation-organized distribution rather than smooth income sorting alone, and that the institutions already working in Black Chicago (cultural as much as clinical) are standing on the city's deepest hardship geography.
WHAT REMAINS DISPUTED OR UNKNOWN
Why the gradient exists (the channels are unseparated, and part of the association may be structural to the federal model); what the rates are for Black Chicagoans as individuals (the source publishes no race-specific tract rate); and whether the overlap geography is moving.
WHAT CTL SHOULD RESEARCH NEXT
The full social-needs battery on the same frame (§22), the next PLACES release for a time dimension, and the institutions overlay — CTL's own cultural graph read against the 172 tracts — so the Public Health lane documents not only where the pressure is, but who has been carrying the response.
For Young Readers
CULTURETECHLENS "Culture, Clearly Seen." Black Cultural Intelligence
The same facts, in plain words · Companion to CTL-RB-HEALTH-000001
Cite as: CultureTechLens, "The Table and the Roof — For Young Readers," October 27, 2026. Source: CultureTechLens
Every family needs two things before anything else: food on the table, and a roof that stays over their heads. This study asked a simple question: in Chicago, where is it hardest for families to hold on to those two things — and does that map match the map of where Black families live?
Scientists at the CDC, the country's public health agency, used a giant health survey to estimate, for every small neighborhood area in the city (called a census tract), how many grown-ups had worried in the last year about affording food, and how many had worried about paying for their home.
Here is what the numbers show. In the neighborhoods where most residents are Black, about 40 out of every 100 adults had trouble affording food. In the neighborhoods where few residents are Black, it was about 16 out of 100. Housing trouble shows the same pattern: about 32 out of 100 in mostly-Black neighborhoods, about 13 out of 100 in the others. And the neighborhoods that struggle with food are almost exactly the same neighborhoods that struggle with housing — 172 of them struggle with both at the same time, and more than 300,000 Black Chicagoans live in those 172 neighborhoods.
Two honest notes. First, these are careful estimates from a survey, not a knock on every door — the study says so on its maps. Second, the maps show where the struggle is. They cannot by themselves explain why — that takes more detective work, and honest researchers say that part out loud too.
Why does this matter to you? Because the neighborhoods carrying the heaviest load are also the neighborhoods that gave the city its music, its churches, its food, and its stories. The people there are not just struggling — they are carrying a culture the whole world loves. Knowing the true map is the first step to making sure those neighborhoods get seen, counted, and helped first.
Source: CultureTechLens. Full study: brief.md in this package, with maps and data in the CultureTechLens Public Health Pair.