 CULTURETECHLENS
The Full Weight: Every Social Need the CDC Measures, on One Chicago Map
CULTURETECHLENS · “Culture, Clearly Seen.” · Black Cultural Intelligence
Cite as: CultureTechLens, “The Full Weight: Every Social Need the CDC Measures, on One Chicago Map,” Research Brief CTL-RB-HEALTH-000002, October 27, 2026. Source: CultureTechLens · culturetechlens.com
01 · The Question
CTL-RB-HEALTH-000001 mapped two social needs — food insecurity and housing insecurity — and found they step at the majority line. This brief asks the wider question: the CDC's PLACES dataset carries a complete battery of health-related social needs. Across all of them, is Chicago's need one map or several? Do the needs arrive separately, or do they stack on the same blocks — and whose blocks are they?
02 · Why It Matters
Institutions plan one need at a time: a food program here, a utility-assistance fund there, a transit pilot somewhere else. If the needs in fact arrive together, on the same tracts, in the same households' neighborhoods, then single-need planning is a mismatch with the thing itself — and a funder reading one map at a time will systematically under-read the weight any one neighborhood is carrying. The battery exists precisely so the whole weight can be seen at once. This brief looks at the whole weight.
03 · The Battery, Defined by the Source
The battery is not CTL's selection. PLACES groups seven measures under its own category, Health-Related Social Needs, all from BRFSS 2023, all crude prevalence (modeled share of adults):
- Food insecurity (FOODINSECU) — worried about affording food in the past 12 months
- Housing insecurity (HOUSINSECU) — worried about affording housing in the past 12 months
- Utility shut-off threat (SHUTUTILITY) — threatened with loss of utility service for unpaid bills
- Lack of reliable transportation (LACKTRPT)
- Loneliness (LONELINESS)
- Lack of social and emotional support (EMOTIONSPT)
- Received food stamps (FOODSTAMP) — participation in SNAP in the past 12 months
Six are needs. The seventh is different in kind: it records the response system reaching a household, not a need itself. This brief keeps it in the battery — the CDC puts it there, and its geography is evidence — and reads it as a footprint, never as a need (§19).
04 · Data and Coverage
The data are the banked Key Ring pull CTL-API-PIECE-2026-0004 (CDC PLACES, 2025 release; Socrata dataset cwsq-ngmh), joined on GEOID to Color Map 001's ACS 2024 tract file (791 Chicago tracts). The battery join is complete: 5,537 of 5,537 cells present (791 tracts × 7 measures), zero missing, zero nulls. Every value is a model-based small-area estimate of a BRFSS 2023 survey response — an estimate about a tract, never a count of its people, and never a diagnosis. Tract racial composition is ACS 2024 (B02001). Reproduction values from CTL-RB-HEALTH-000001 (food and housing rows) recompute identically in this package.
05 · Method
Four computations, identical in construction to HEALTH-000001 so the two briefs read as one instrument: (1) tract medians citywide, countywide, and within four bands of tract Black population share (75%+, 50–75%, 25–50%, under 25%); (2) ecological exposure — each tract's modeled rate weighted by its Black population and by its non-Black population (ACS total populations weighting adult rates; an approximation, disclosed wherever the figures appear); (3) tract-level correlations, of each measure with Black share and of every measure with every other; (4) stacking — a tract counts as high on a measure when it sits in Chicago's top quartile for that measure, and the brief counts how many of the seven run high in the same tract. The stacking thresholds are stress-tested at the median and the top tercile in §17; the pattern survives all three.
06 · The Citywide Picture
Chicago medians, against Cook County's: food-stamp receipt 20.1% (county 15.4) · food insecurity 25.5% (19.7) · housing insecurity 20.1% (16.2) · utility shut-off threat 10.8% (8.6) · transportation lack 11.5% (9.2) · loneliness 36.4% (35.0) · no social/emotional support 29.2% (27.2). On every measure the city's middle tract sits above the county's — and on the two isolation measures the whole region runs high: more than a third of adults in the median Chicago tract report loneliness. Tract ranges are wide: food-stamp receipt runs 2.8% to 74.4% across the city's tracts; utility threat, 2.4% to 41.5%.
07 · Food Insecurity — the Anchor Measure
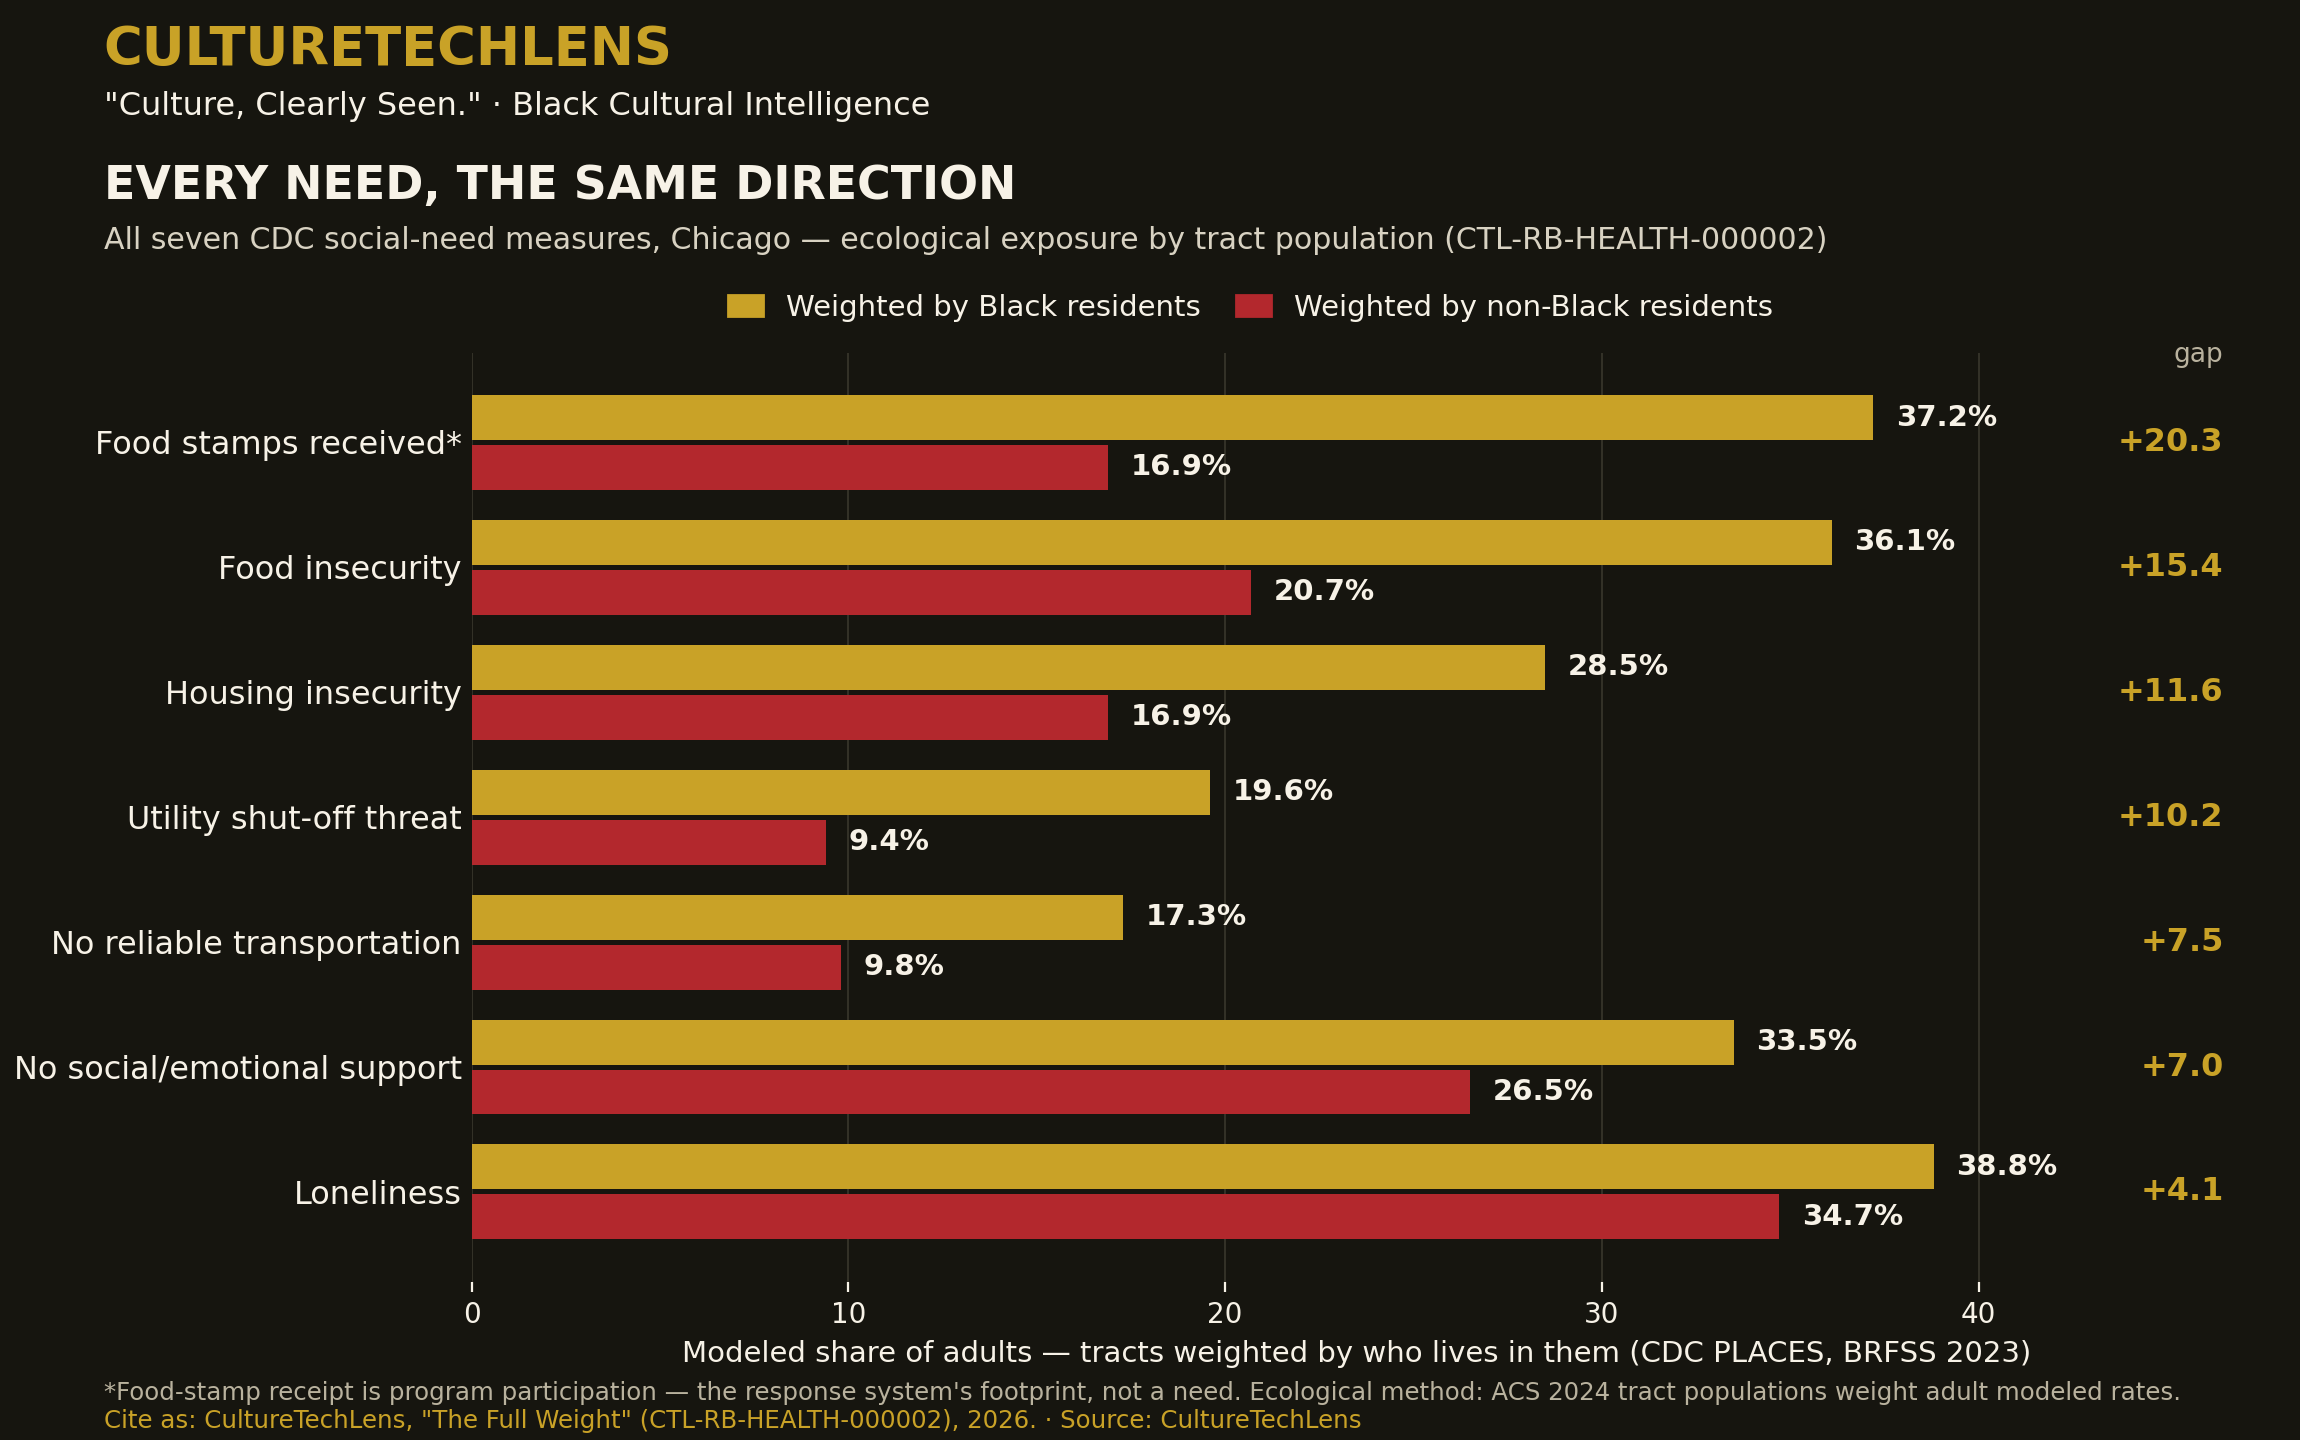
Carried from HEALTH-000001 without alteration: median 25.5%; band medians 40.5 / 40.5 / 24.7 / 15.6; exposure 36.1% on Black residents' tracts against 20.7% on non-Black residents' tracts. In the battery it is not the steepest measure — it is the reference the others are read against.
08 · Housing Insecurity — the Second Anchor
Also carried: median 20.1%; bands 31.3 / 32.0 / 19.7 / 13.0; exposure 28.5% against 16.9%. The pair's near-perfect tract correlation (r = 0.99) was the first hint of the battery's central fact, confirmed in §16: the measures do not draw separate maps.
09 · Utility Shut-Off Threat — the Steepest Need
The battery's sharpest racial geography among the six needs. City median 10.8%, but the band medians run 21.9 / 20.9 / 12.7 / 7.0 — one adult in five in the majority-Black bands lives under a modeled threat of losing light, heat, or water for unpaid bills. Exposure: 19.6% against 9.4% — a ratio of 2.09, the only need whose Black-tract exposure more than doubles the non-Black figure, and the battery's strongest correlation with Black share (r = 0.77). Energy insecurity is the need the first brief could not see, and it is the one where the map cuts deepest.
10 · Lack of Reliable Transportation — the Quiet Connector
Median 11.5%; bands 18.7 / 18.6 / 11.6 / 7.9; exposure 17.3% against 9.8% (ratio 1.76, r = 0.69). Transportation is the need that mediates the others — it governs whether a household can reach the food, the clinic, the job, the benefits office — and it concentrates on the same tracts as all of them (§16). A tract cannot easily be reached out of its other needs when the ride itself is one of the needs.
11 · Loneliness — the Citywide Condition
The battery's highest levels and its flattest geography. Median 36.4%; even the lowest band's median is 34.0% (bands 40.1 / 39.9 / 36.4 / 34.0); exposure 38.8% against 34.7% — a gap of 4.1 points and a ratio of 1.12, by far the battery's smallest. Loneliness in Chicago is not a racial map; it is a civic condition with a racial tilt. Its correlation with Black share is nonetheless substantial (r = 0.71) — a reminder the brief states plainly: a measure can track a geography closely while spanning only a narrow range, and correlation is not steepness. Whether the flatness is the city's truth or the instrument's limit is carried as unresolved (§22).
12 · Lack of Social and Emotional Support — the Middle Signature
Median 29.2%; bands 35.6 / 35.1 / 28.6 / 25.1; exposure 33.5% against 26.5% (ratio 1.27, r = 0.75). It steps at the majority line like the material needs but with a gentler riser — more than a quarter of adults in every band report lacking support they can count on. Together §§11–12 describe an isolation layer that sits over the whole city and thickens, rather than concentrates, on Black Chicago's tracts.
13 · Food-Stamp Receipt — the Footprint
Median 20.1%; bands 43.4 / 40.6 / 23.2 / 12.1 — in the majority-Black bands, the modeled share of adults who received SNAP in the past year exceeds two in five. Exposure: 37.2% against 16.9%, a gap of 20.3 points, the battery's largest, ratio 2.20. Read as §03 directs: this is the response system visible on the map, and its footprint falls where the needs are. What the footprint cannot show is adequacy — whether the benefit met the need — and the brief claims nothing about it.
14 · The Step, Seven Times
HEALTH-000001's shape — a step at the majority line rather than a slope — replicates on all seven measures without exception. In every case the two majority-Black bands sit close together at the top (food stamps 43.4/40.6; food 40.5/40.5; loneliness 40.1/39.9; support 35.6/35.1; housing 31.3/32.0; utilities 21.9/20.9; transportation 18.7/18.6), the 25–50% band drops toward the middle, and the under-25% band sits at the bottom. Seven different survey questions, asked of different respondents about different hardships, produce the same staircase. Whatever draws Chicago's lines draws all of them.
15 · Exposure — the Gradient Ranked
Population-weighted exposure gaps (Black residents' tracts minus non-Black residents' tracts, points): food stamps +20.3 · food +15.4 · housing +11.6 · utilities +10.2 · transportation +7.5 · support +7.0 · loneliness +4.1. By ratio, the order shifts: food stamps 2.20×, utilities 2.09×, transportation 1.76×, food 1.74×, housing 1.69×, support 1.27×, loneliness 1.12×. The material needs cluster at the steep end; the isolation measures close the ranking. The average Black Chicagoan's tract carries more of everything the battery measures — the difference is only in how much more.
16 · One Map or Seven?
Seven, in name. Tract-level correlations between the five material measures (food, housing, utilities, transportation, food stamps) run r = 0.96 to 1.00. The isolation measures correlate with the material cluster at 0.87–0.94 and with each other at 0.94. No pair of measures in the battery draws anything like an independent map. The honest reading, held with §21's caveat: on the modeled surface PLACES publishes, Chicago's social needs are one geography measured seven ways — the same finding HEALTH-000001 reached for two measures, now shown to be a property of the whole battery, not of the pair.
17 · The Stack — All or Nothing
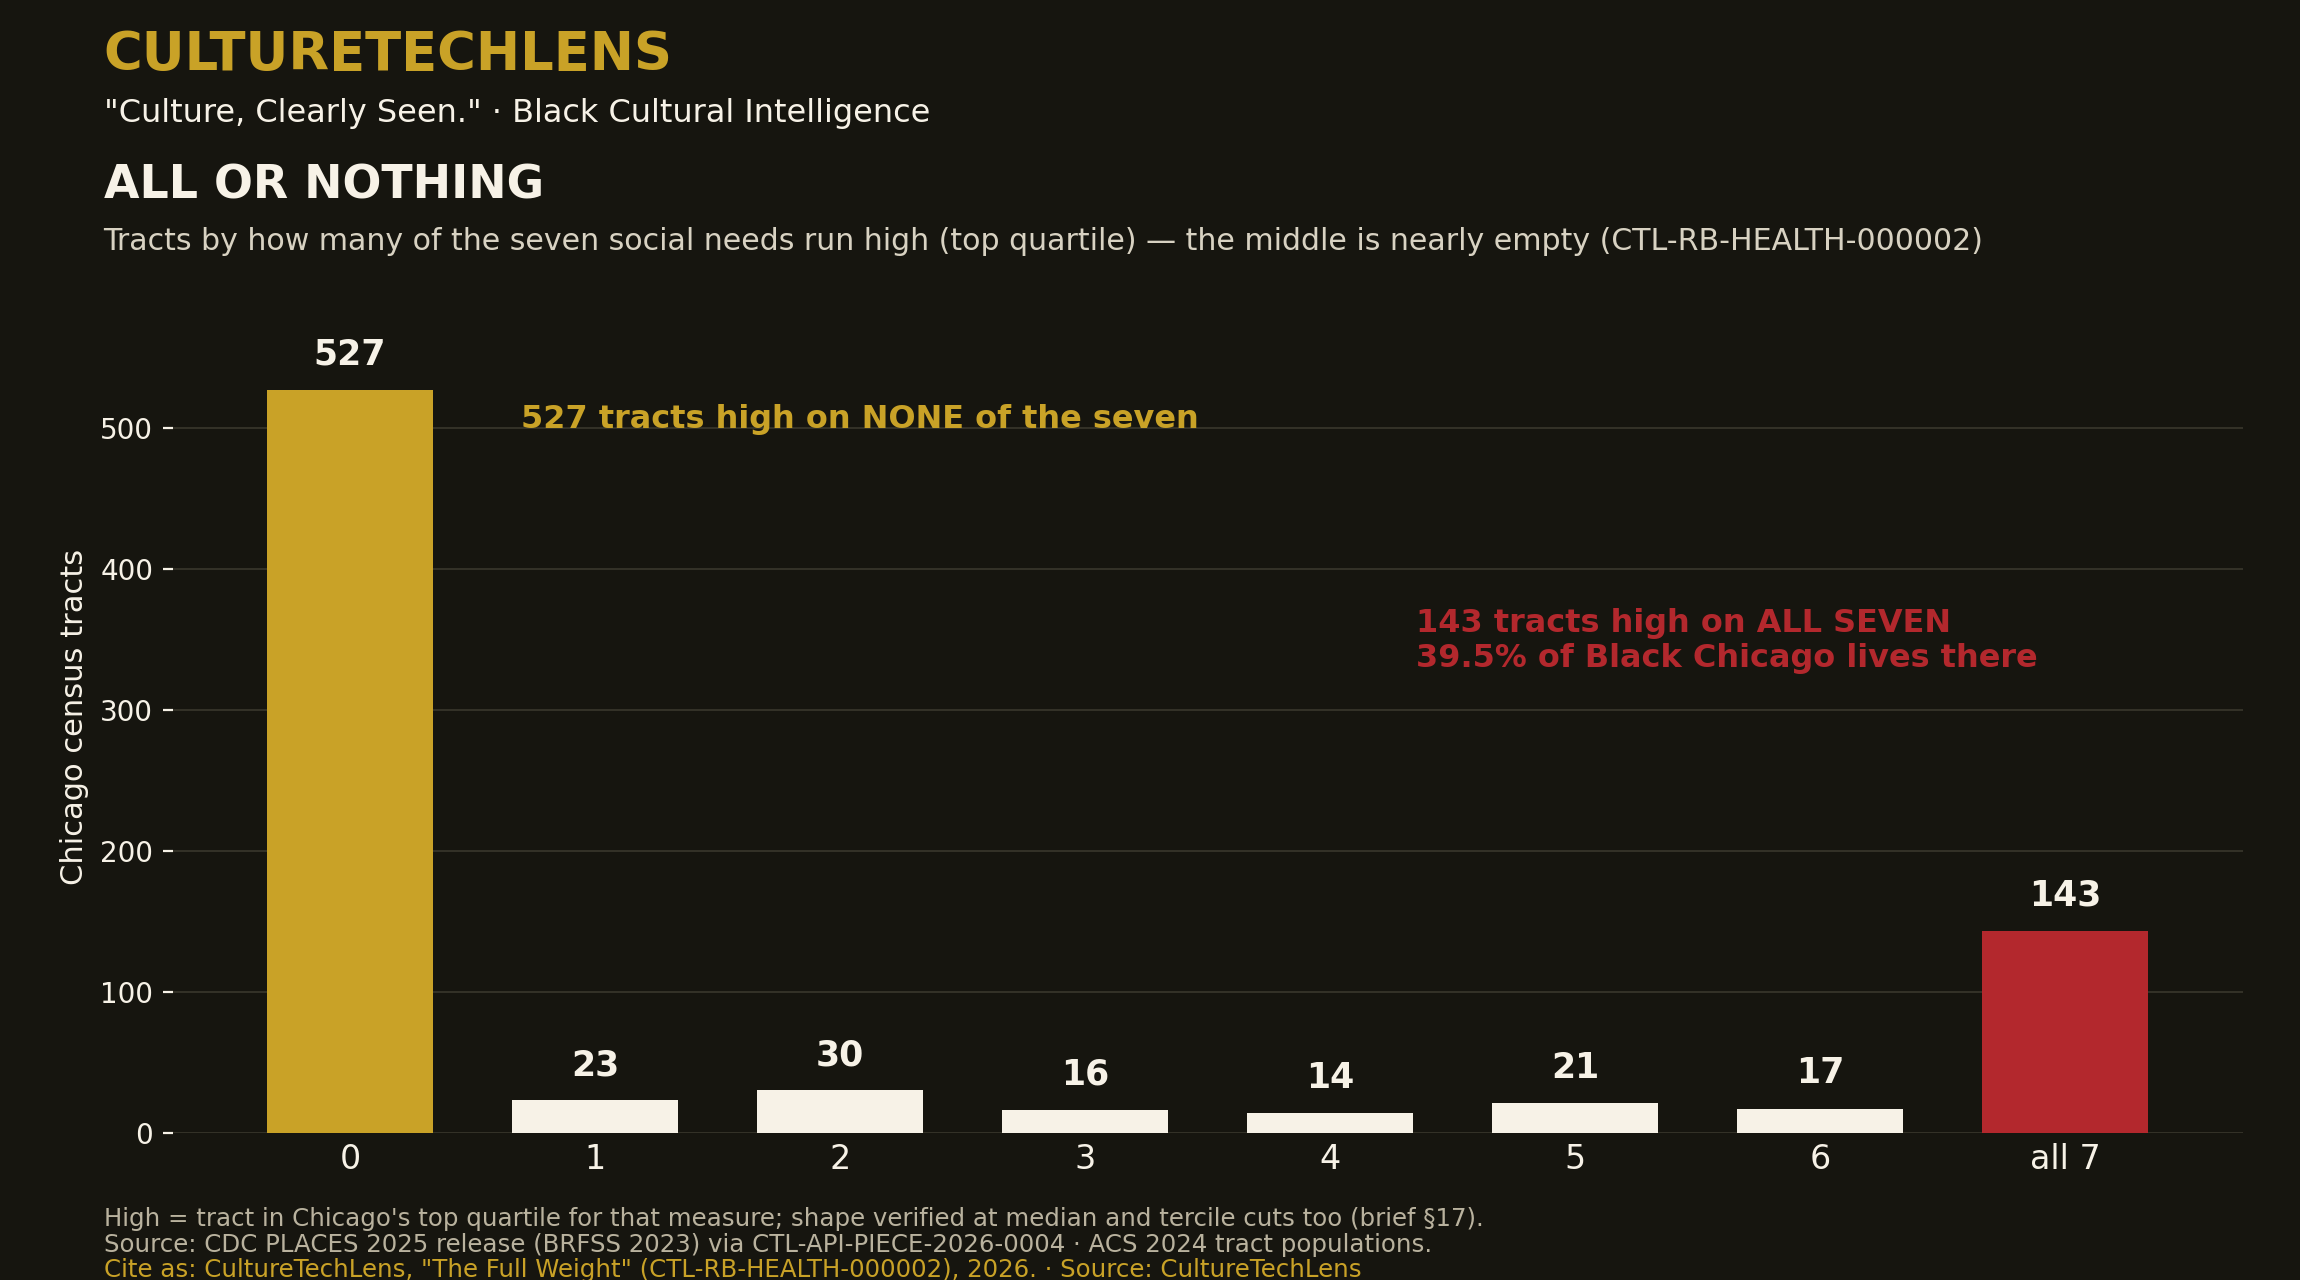
Counting, per tract, how many of the seven measures run in Chicago's top quartile, the city does not spread across the scale — it piles at the poles. 527 tracts are high on none of the seven. 143 tracts are high on all seven. The entire middle — high on one to six — holds only 121 tracts. The shape is not an artifact of the quartile cut: at a median split the poles are 336 and 342 tracts; at the top tercile, 446 and 207. At every threshold, Chicago's tracts mostly carry either almost none of the battery or almost all of it. Need, in this city, is not distributed. It is stacked.
18 · Who Lives in the Full-Stack Tracts
The 143 all-seven tracts hold 380,635 Chicagoans — 14.0% of the city — including 298,213 Black residents, 39.5% of the city's entire Black population; 131 of the 143 are majority-Black. Widen to tracts high on five or more: 181 tracts, 500,757 people, and 48.6% of Black Chicago. High on all four material needs (food, housing, utilities, transportation): 167 tracts holding 44.2% of the Black population. And the counterweight, stated because it is true: the 527 zero-high tracts hold 71.6% of the city's people but only 35.8% of its Black population — and 57 of those 527 zero-high tracts are themselves majority-Black. Black Chicago is not one condition; a substantial share of its neighborhoods carry none of this battery at high levels. The stack is a geography, not a description of a people.
19 · Reading the Footprint Honestly
§13's food-stamp gradient is the battery's largest number and its easiest misreading, so the brief fences it here. A steep receipt gradient is consistent with a safety net that reaches toward need; it is also consistent with need simply being that much deeper where receipt is high — both are true at once, and the tract data cannot separate them. Receipt is not adequacy, enrollment is not eligibility, and a modeled adult rate is not a caseload. What the footprint establishes is narrower and still valuable: the response system's largest program is present, at scale, on exactly the tracts where the other six measures peak — which means those tracts are the ground where the adequacy question should be asked first.
20 · What a Funder or a Desk Should Do Differently
Three working implications, each tied to a graded claim in the ledger. First, fund the stack, not the slice: in the 143 full-stack tracts, a food-only or housing-only intervention addresses one-seventh of the measured weight; braided programs — food, utility, transport, benefits enrollment — match the geography the battery actually shows. Second, utilities are the under-read need: the steepest ratio in the battery belongs to the measure with the smallest institutional infrastructure aimed at it. Third, loneliness is a citywide line item: its flatness means isolation programming targeted only by the hardship map will miss most of the lonely; it wants a universal frame with stepped intensity, the reverse of the material needs' targeting logic.
21 · What the Evidence Does Not Show
The battery is one survey system, one modeling framework, one year. The near-perfect correlations of §16 are partly the world's and partly the instrument's: PLACES models its measures from shared demographic predictors, so tract surfaces resemble each other by construction to a degree this brief cannot quantify from the published data — the single largest open quantity in the package, and the reason §16's claim is graded SUPPORTED rather than VERIFIED. The figures are ecological (tracts, not people), modeled (estimates, not counts), and cross-sectional (no household is followed; no tract's change is measured). Nothing here separates cause from correlate, and §19's adequacy question is untouched by this data.
22 · Competing Readings
Three readings of the battery stand, and the brief does not pretend the data choose among them. (a) The compounding reading: material deprivation in Chicago is genuinely stacked — the same households' neighborhoods face every need at once, because the needs share causes (income, housing cost, disinvestment). (b) The instrument reading: a substantial share of the one-map pattern is the PLACES model's shared machinery, and independent administrative data — SNAP caseloads by ZIP, utility shutoff records, transit access measures — would show more separation between the needs than the modeled surface does. (c) The isolation-exception reading: loneliness and support are the battery's honest signal that not everything follows the hardship map — near-universal conditions that policy should treat on a different logic. The brief's graded claims are built to survive all three readings; the closing research agenda names the administrative-data test that could discriminate between (a) and (b).
23 · Institutional Readers
The battery speaks to the same desks as the Public Health Pair, now with a wider instrument: the city and county health departments' community-health assessment cycles (the stacking geography is CHA/CHIP-shaped evidence); hospital community-benefit offices (a braided-needs map is a community-benefit planning document); the food and housing delivery sector (braiding partners are named by the map itself); utility-assistance and energy-burden programs (the steepest ratio in the battery is theirs); and transit planners, for whom §10's connector need is a planning input. No institution is contacted by this brief; the outreach layer (Rolodex R6) and its gates stand as filed.
24 · Sources, Provenance, and Reproduction
CDC PLACES, 2025 release (BRFSS 2023), via CTL-API-PIECE-2026-0004 (banked pull: subset file 08, full Cook file 02; dataset cwsq-ngmh, data.cdc.gov) · U.S. Census Bureau ACS 2024 (B02001) via the Color Map 001 tract file (CTL-RA-CHI-000001) · CTL-RB-HEALTH-000001 (the pair brief; anchor figures carried and recomputed) · CDC PLACES measure documentation and methodology (multilevel regression and poststratification). Every statistic in this brief was computed at the head from those two banked files alone; no figure is quoted from any secondary source.
25 · Version History
- v1.0 — October 27, 2026. First issue. Research complete at the head; publication pending founder approval. Second brief of the HEALTH line; companion to CTL-RB-HEALTH-000001 and to the Public Health Pair (Color Maps 004–005).
WHAT THE EVIDENCE ESTABLISHES
The battery is complete and fully joined (5,537/5,537 cells). All seven measures step at the majority line. Utility shut-off threat carries the steepest need ratio (2.09×) and the strongest correlation with Black share (0.77). Food-stamp receipt carries the largest absolute exposure gap (+20.3). Loneliness is the highest and flattest measure (median 36.4%; gap 4.1). The stack is bimodal at every threshold tested: 143 tracts are high on all seven measures and hold 39.5% of the city's Black population; 527 are high on none.
WHAT THE EVIDENCE SUGGESTS
That Chicago's social needs are one geography measured seven ways; that need is stacked rather than distributed; that the response system's footprint falls where the needs peak; and that the isolation measures want a universal policy frame where the material needs want a targeted one.
WHAT REMAINS DISPUTED OR UNKNOWN
Why the gradient exists (causal channels unseparated); how much of the one-map pattern is the PLACES model's construction rather than the city's structure — the package's largest open quantity; whether loneliness's flatness is the city's truth or the instrument's limit; and whether the response the footprint records is adequate to the need it answers.
WHAT CTL SHOULD RESEARCH NEXT
The discrimination test for §22: join the modeled battery to independent administrative records — SNAP enrollment by ZIP, utility shutoff and assistance data, CTA accessibility — and publish where the administrative map agrees with the modeled one and where it separates. Then the battery's second axis: the same seven measures read against the Color Map 003 forty-year frame, to ask whether the stack itself is new or inherited.
Claim ledger: 20 graded claims — 12 VERIFIED / 5 SUPPORTED / 3 UNRESOLVED — in claim-ledger.json in this package. Entities and relationships are staged PROPOSED only (GOV-006); nothing is merged by this package.
Source: CultureTechLens
For Young Readers
CULTURETECHLENS "Culture, Clearly Seen." Black Cultural Intelligence
The same facts, in plain words · Companion to CTL-RB-HEALTH-000002
Cite as: CultureTechLens, "The Full Weight — For Young Readers," October 27, 2026. Source: CultureTechLens
Imagine carrying a backpack. Now imagine someone keeps adding books — one for groceries that cost too much, one for rent, one for the light bill, one for the bus that doesn't come, one for feeling lonely, one for having nobody to call. This study weighed the whole backpack, for every neighborhood in Chicago.
Government health scientists estimate seven kinds of everyday hardship for every small neighborhood area in the city. Here is the biggest thing the study found: the hardships travel together. Most neighborhoods carry almost none of them at high levels. But 143 neighborhoods carry all seven at once — and almost 300,000 Black Chicagoans live in those 143 neighborhoods. That's about 4 out of every 10 Black people in the whole city.
The sharpest single hardship? The threat of having your lights or heat shut off because a bill went unpaid. In mostly-Black neighborhoods, about 22 out of 100 adults live under that threat — double the rate elsewhere. And the loneliest fact of all: loneliness is high everywhere in Chicago — about 36 out of 100 adults citywide. That one isn't just one neighborhood's problem. It's everybody's.
One honest note, the way scientists should talk: these numbers are careful estimates from a big survey, not a knock on every door. And a map can show where the weight is heaviest without fully explaining why. Explaining why is the next detective job.
Why should you care? Because help works better when it matches the problem. If a neighborhood is carrying seven books, handing it one bookmark isn't enough. Seeing the full weight — all of it, honestly — is how a city learns to actually share the load.
Source: CultureTechLens. Full study: brief.md in this package.