 CULTURETECHLENS
Chicago's Health Needs, Mapped
Source: CultureTechLens.
The answer in five findings
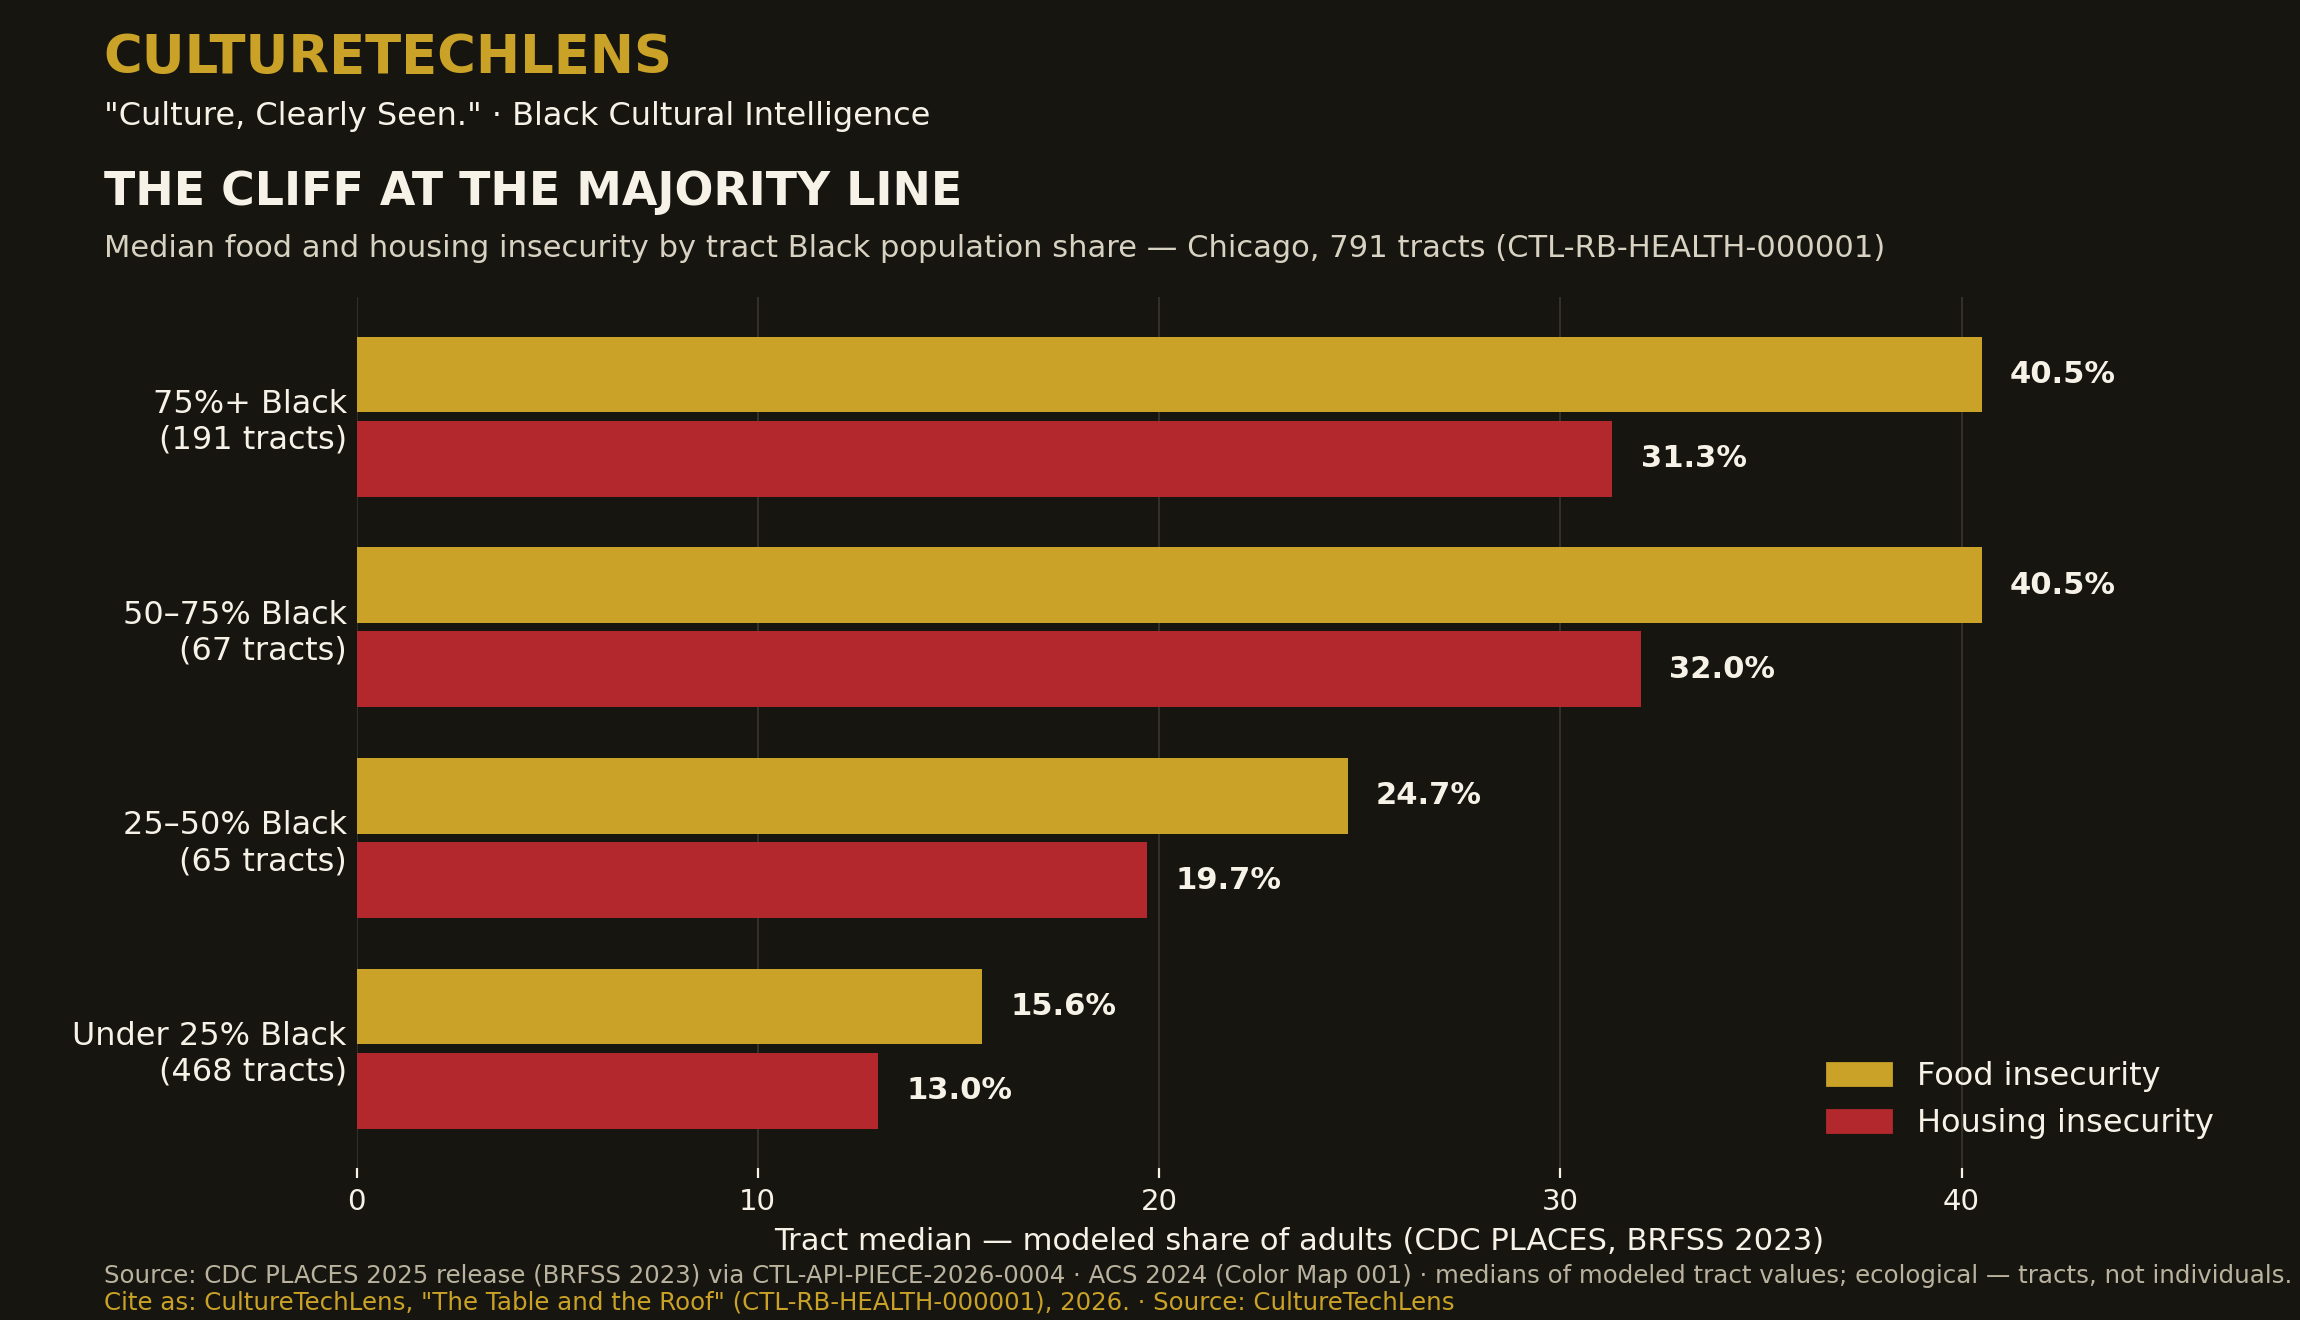
- 1. Food and housing pressure step up at the majority-Black line — they do not slope.
Tract medians for food insecurity: 40.5% in tracts 75%+ Black and 40.5% in tracts 50–75% Black, against 24.7% in tracts 25–50% Black and 15.6% in tracts under 25% Black. Housing insecurity across the same bands: 31.3% / 32.0% / 19.7% / 13.0%. (HEALTH-000001)
- 2. The overlap is the core. Of 172 tracts high on both food and housing insecurity, 132 (77%)
are majority Black. Those tracts hold 314,660 Black Chicagoans — 41.6% of the city's Black population. (HEALTH-000001)
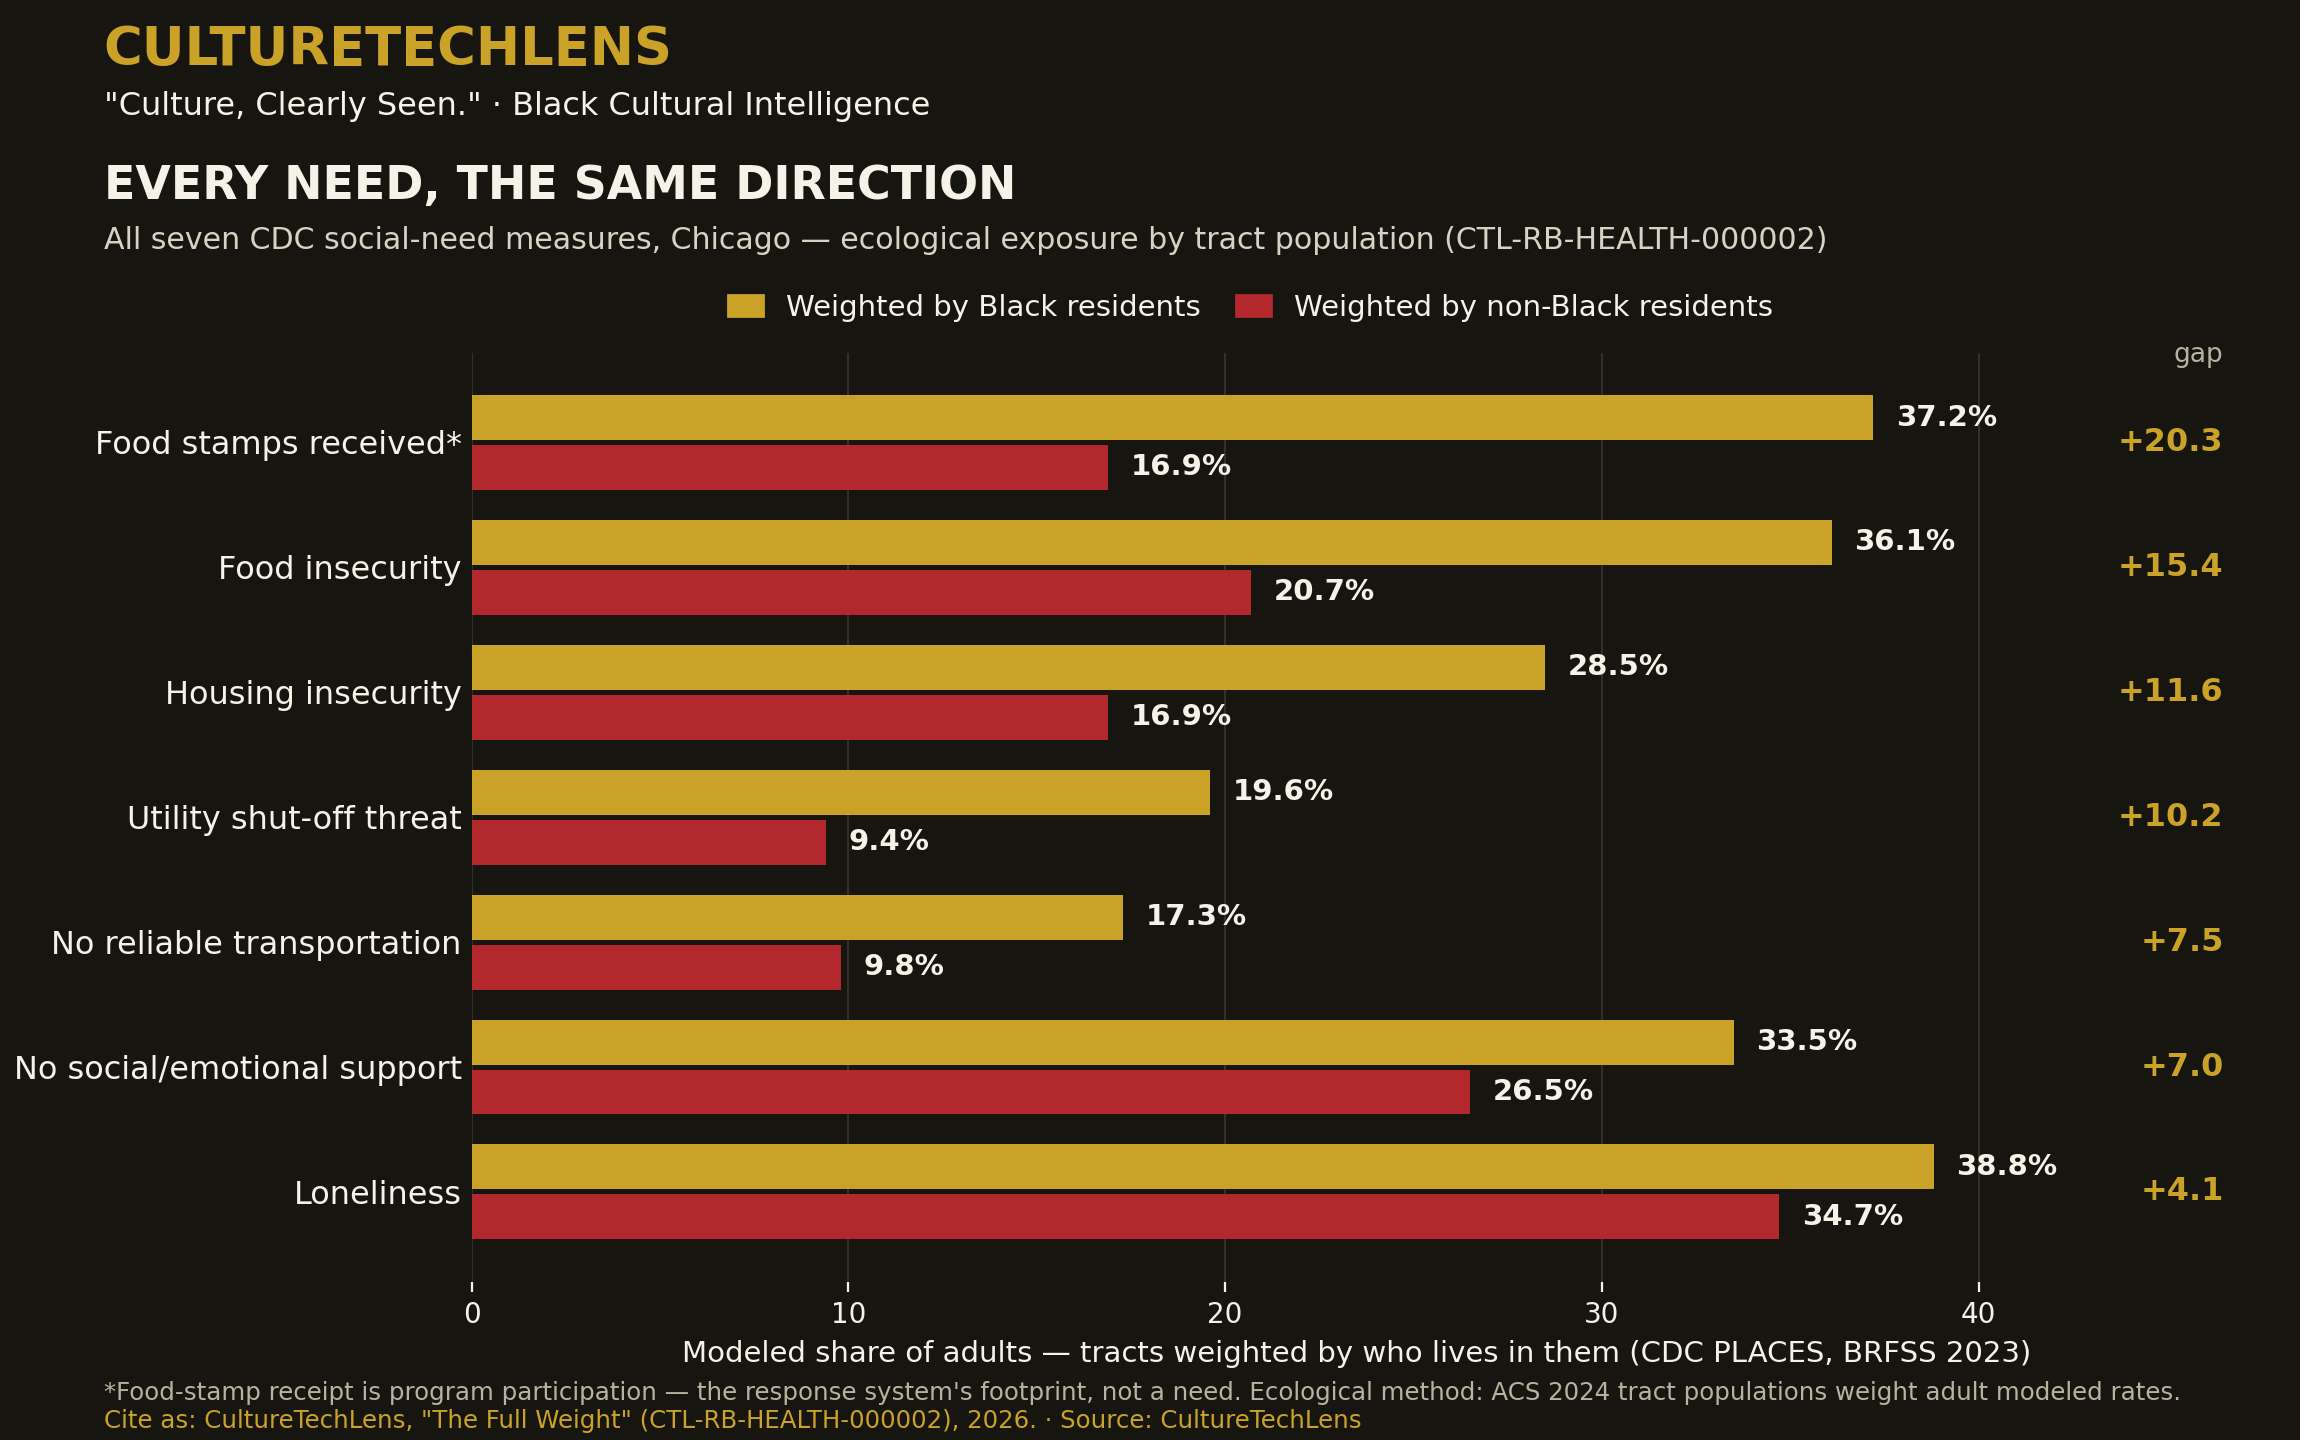
- 3. All seven measured needs draw the same map. The majority-line step replicates on every
CDC PLACES social-need measure in the battery, without exception. (HEALTH-000002)
- 4. Utility shut-off threat is the steepest need. Exposure ratio 2.09× (19.6% vs 9.4%),
the battery's strongest correlation with Black population share (r = 0.77). Food-stamp receipt carries the largest absolute exposure gap (+20.3 points); loneliness is the highest and flattest measure (city median 36.4%, gap +4.1). (HEALTH-000002)
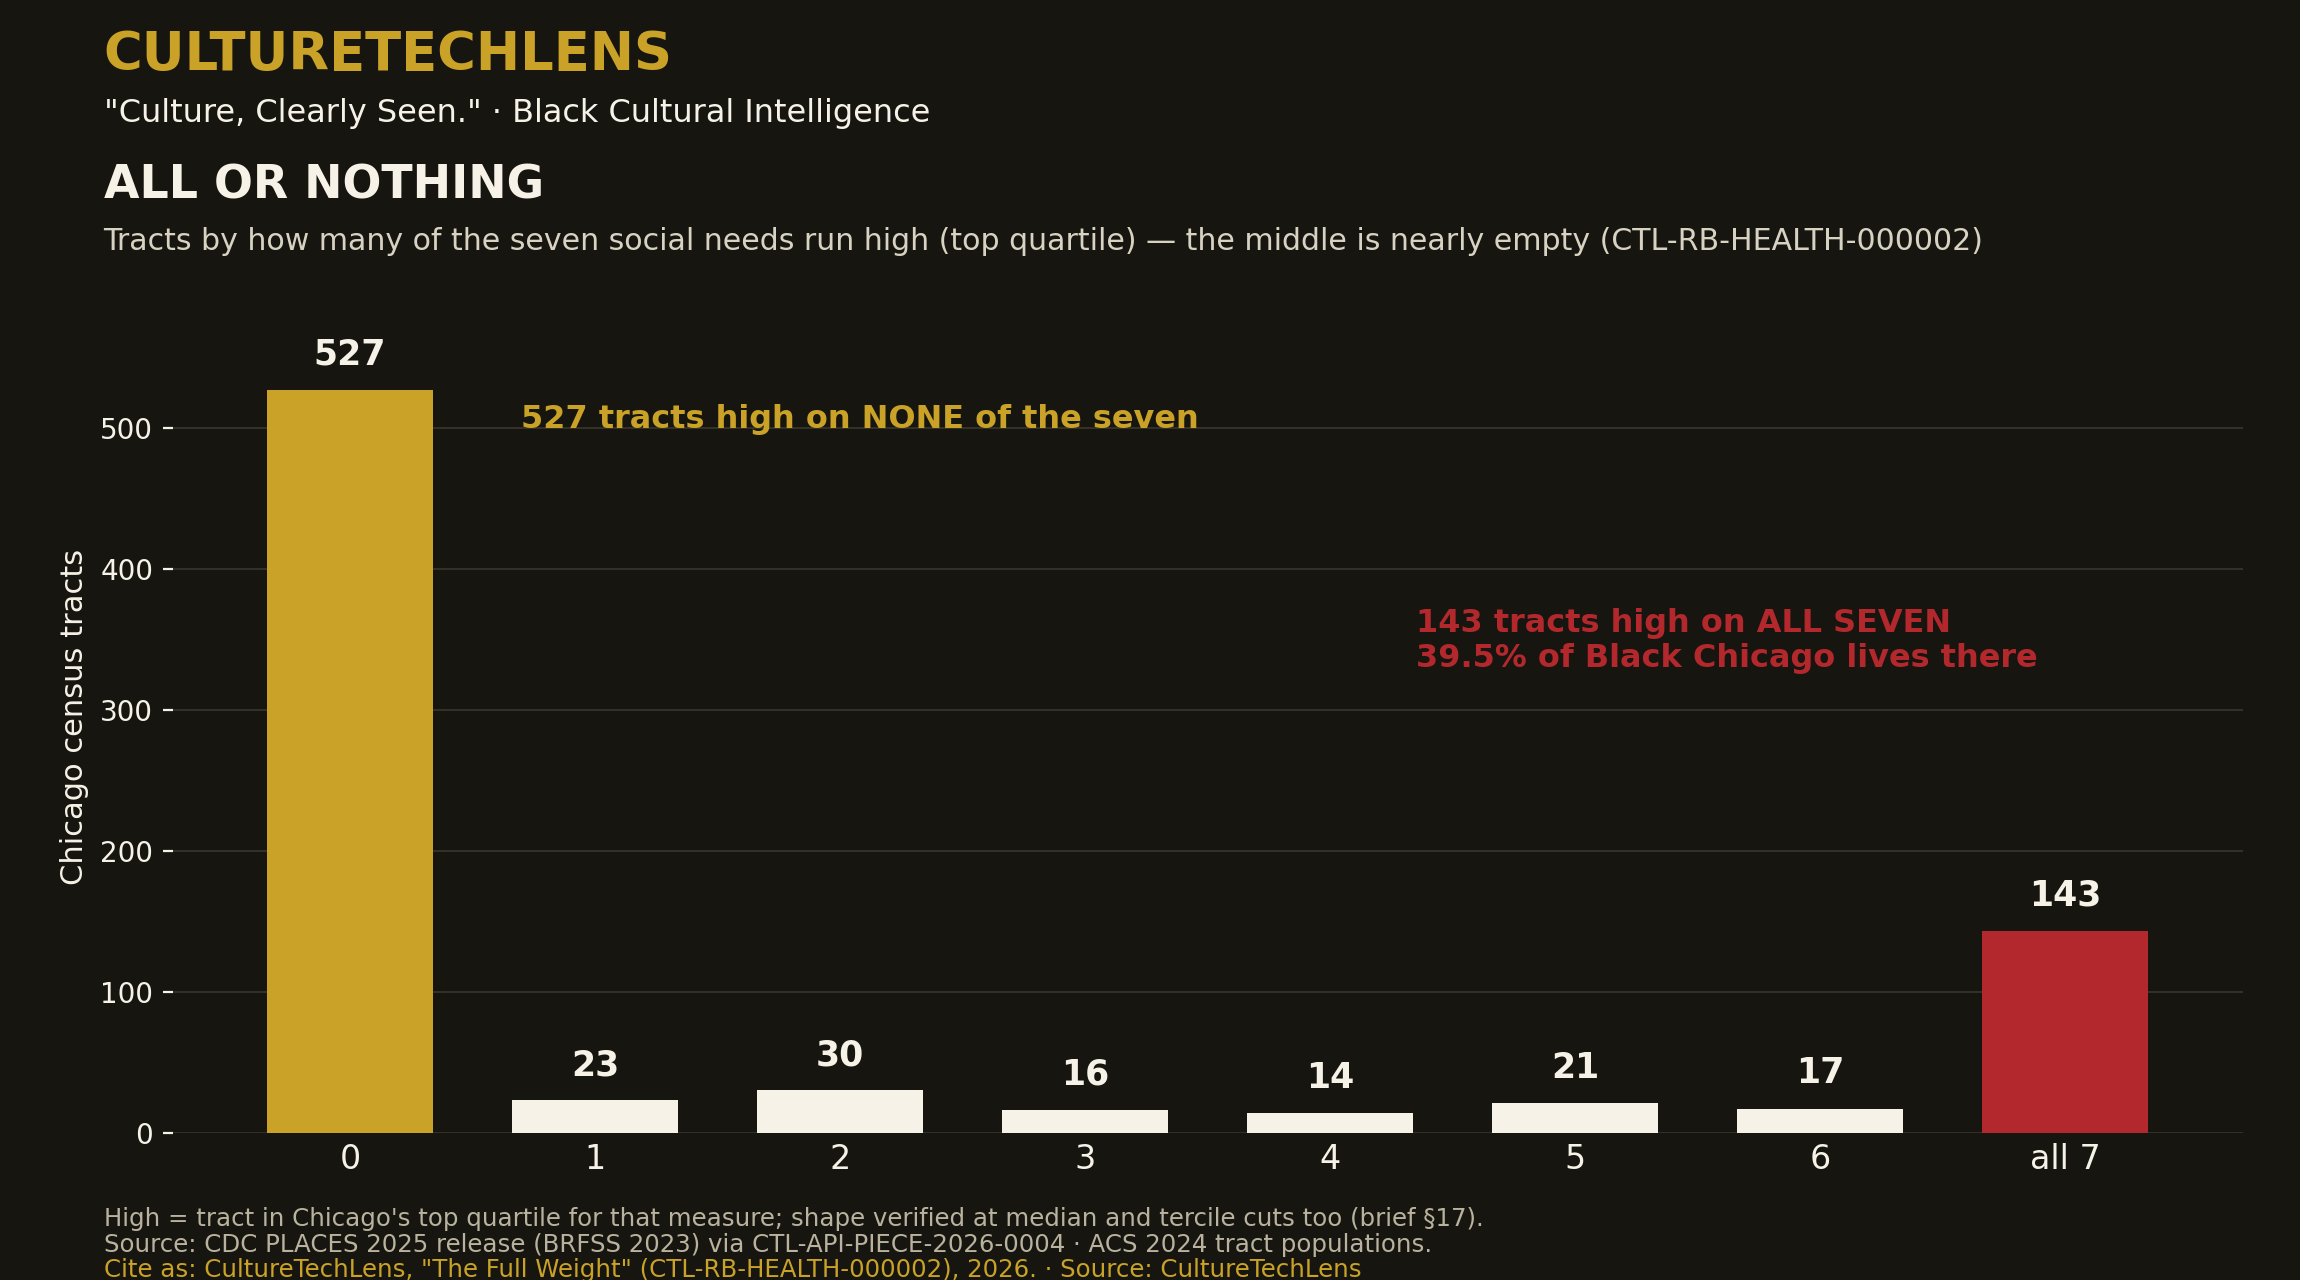
- 5. Need is stacked, not spread. 143 tracts are high on all seven measures — holding 380,635
people, including 298,213 Black residents (39.5% of Black Chicago); 527 tracts are high on none. Fund the stack, not the slice: in the 143 tracts, a food-only program addresses one-seventh of the measured weight. (HEALTH-000002)
What this does not claim
These are CDC PLACES model-based estimates (BRFSS 2023), not counts of households. The briefs hold the causal channels open (§§19–21 of HEALTH-000001): income, rent burden, retail geography, disinvestment, and the model's own structure cannot be separated at tract level. What survives every caveat is the planning fact in Finding 2.
How to verify
Every figure recomputes from two banked datasets joined on the same frame: CDC PLACES tract data (via CTL-API-PIECE-2026-0004) and ACS 2024 tract data (Color Map 001 frame) — 791 of 791 tracts joined for HEALTH-000001; 5,537 of 5,537 cells for the seven-measure battery in HEALTH-000002. Claim ledgers: HEALTH-000001, 18 claims (12 Verified / 5 Supported / 1 Unresolved); HEALTH-000002, 20 claims (12 Verified / 5 Supported / 3 Unresolved).
The charts
Trust & evidence
Evidence before authority. CultureTechLens publishes its methods, its limits, and its corrections alongside its findings. Claims carry grades — VERIFIED, SUPPORTED, PROVISIONAL, DISPUTED, UNRESOLVED — and unknowns are never reported as zero.
Every claim graded. Every source named. Every correction public — see the corrections log.