 CULTURETECHLENS
Color Map 001 — The City Today
Black population share by census tract, Chicago — 27.8% citywide
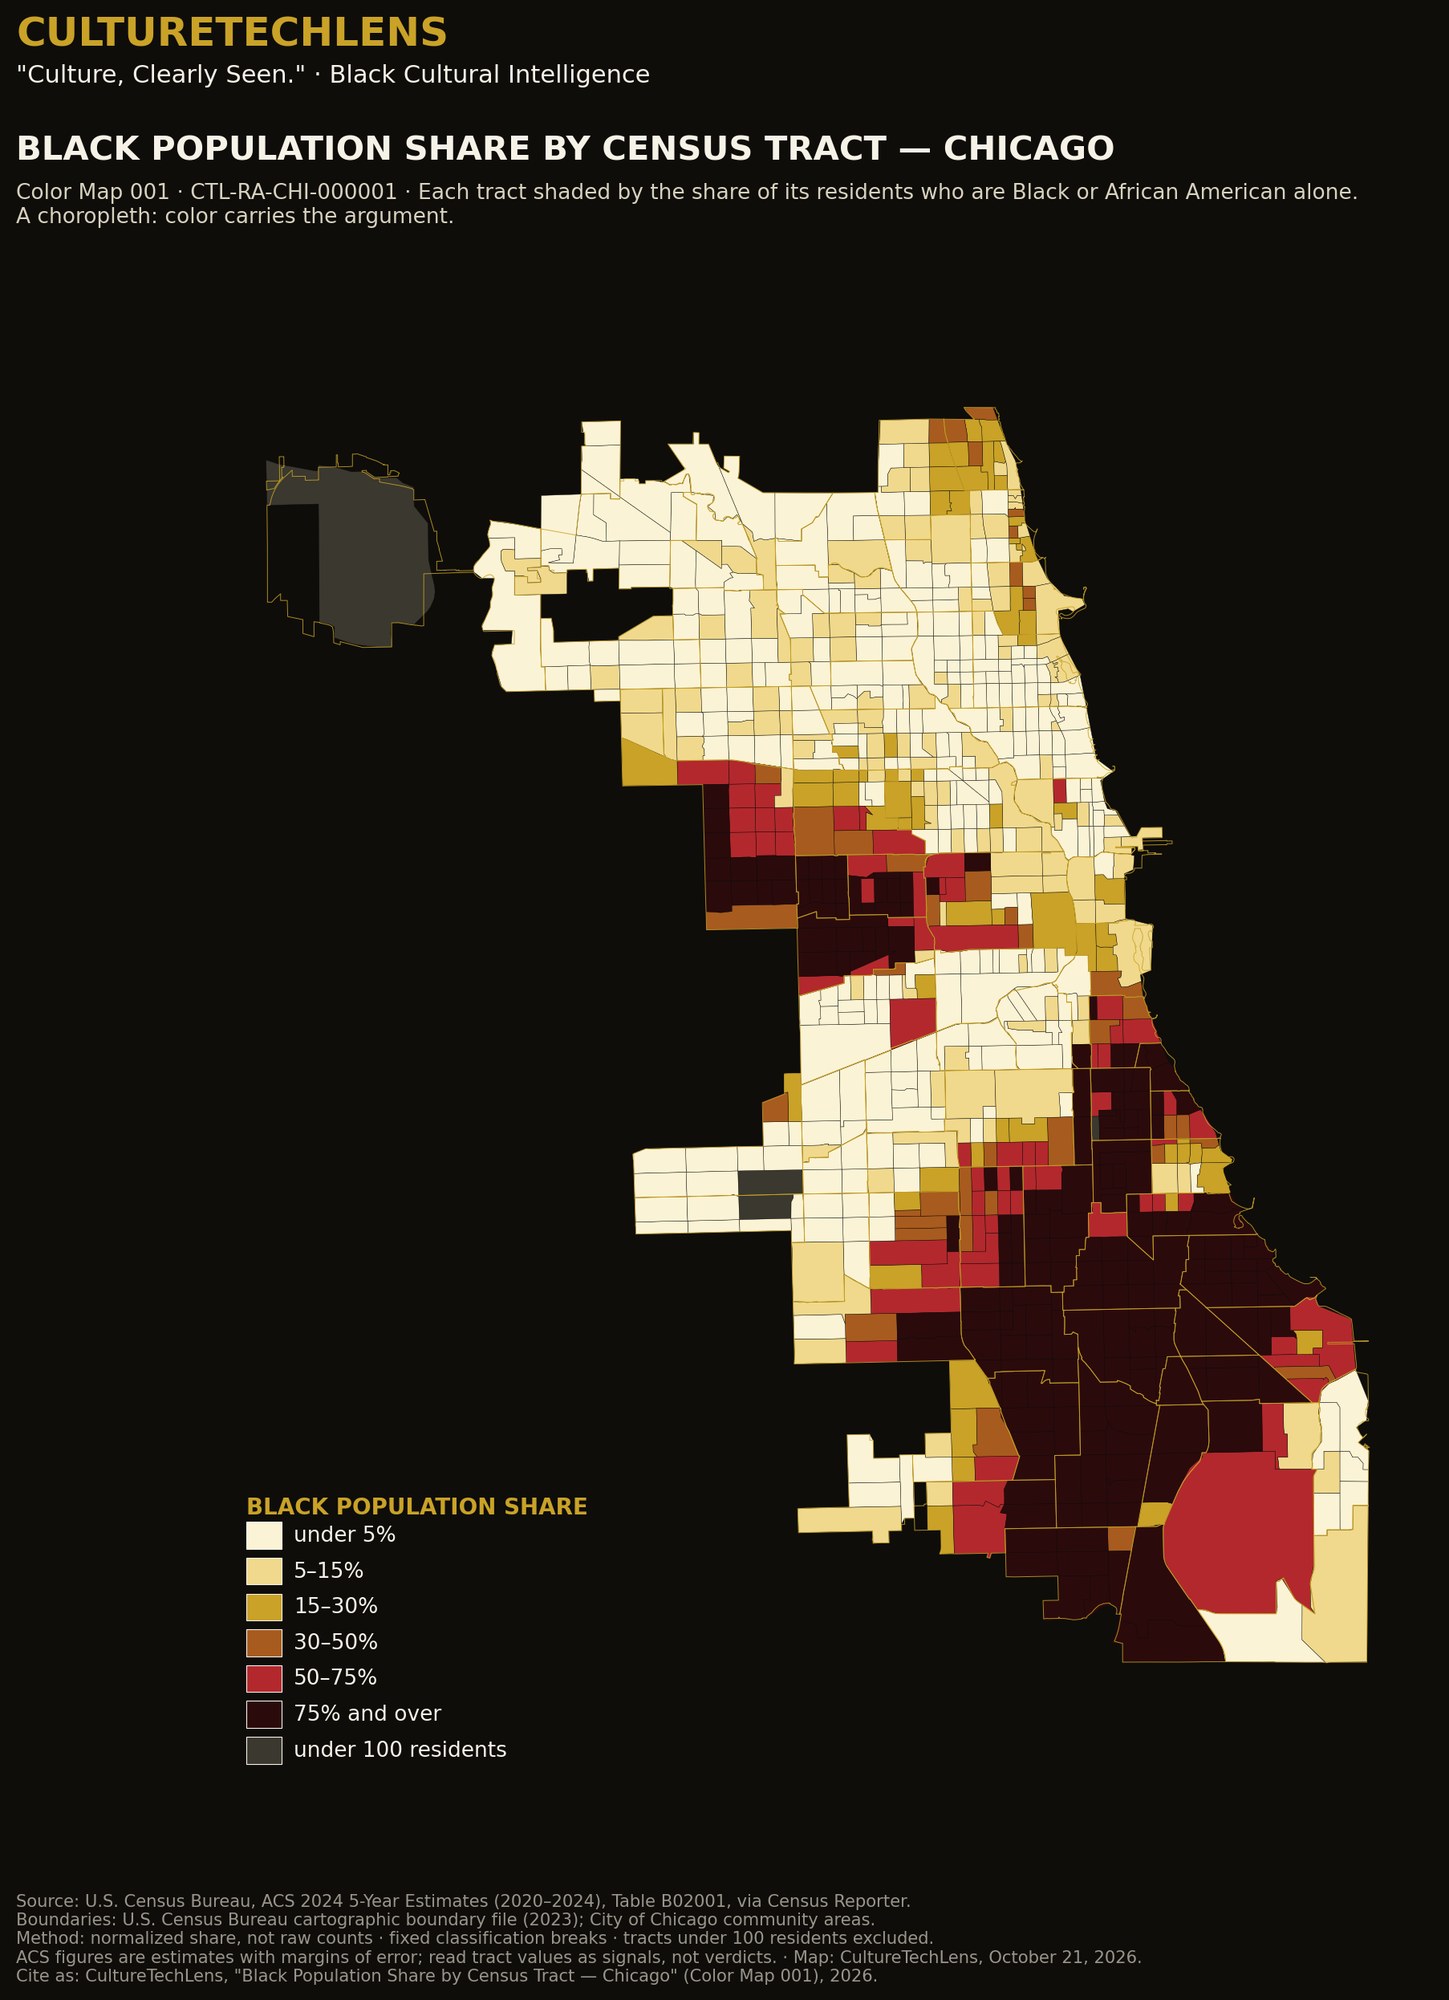
What it documents: Black population share by census tract, Chicago — 27.8% citywide
Data: ACS 2024 5-Year (table B02001), 791 Chicago tracts: 2,719,960 residents, 755,738 Black, 27.8%.
Definition: Black alone (U.S. Census Bureau, American Community Survey).
Verification: Independently re-pulled through the U.S. Census Bureau API on 2026-10-22 — identical to the person.
How to read it: Every map in this set is a share, never a raw count shaded on a map — raw-count choropleths mislead. Population change is a signal, never a verdict: these maps describe where change is happening; they do not, by themselves, explain why.
Part of “Black Chicago in Color — The Three-Map Briefing Set” (CultureTechLens, October 22, 2026), the first published product of the Black Chicago Cultural Atlas (CTL-RA-CHI-000001). Companion reading: the set’s executive brief tells the story the three maps tell together, and its Young Readers companion carries the same facts in plain language — both are delivered with the licensed package.
The briefing set as a research package: print-resolution figures and the tract-level data behind every color (one row per tract: shares and counts) are delivered as “Black Chicago in Color,” a citation-licensed research package for one institution ($750, ratified). Institutions order through Research or [email protected]. A Map Sprint — the same method cut to your own geography — is scoped at $1,500.
Source: CultureTechLens