 CULTURETECHLENS
Color Map 002 — The City in Motion
Black Chicago, ACS 2021 against ACS 2024 — 29.1% to 27.8%
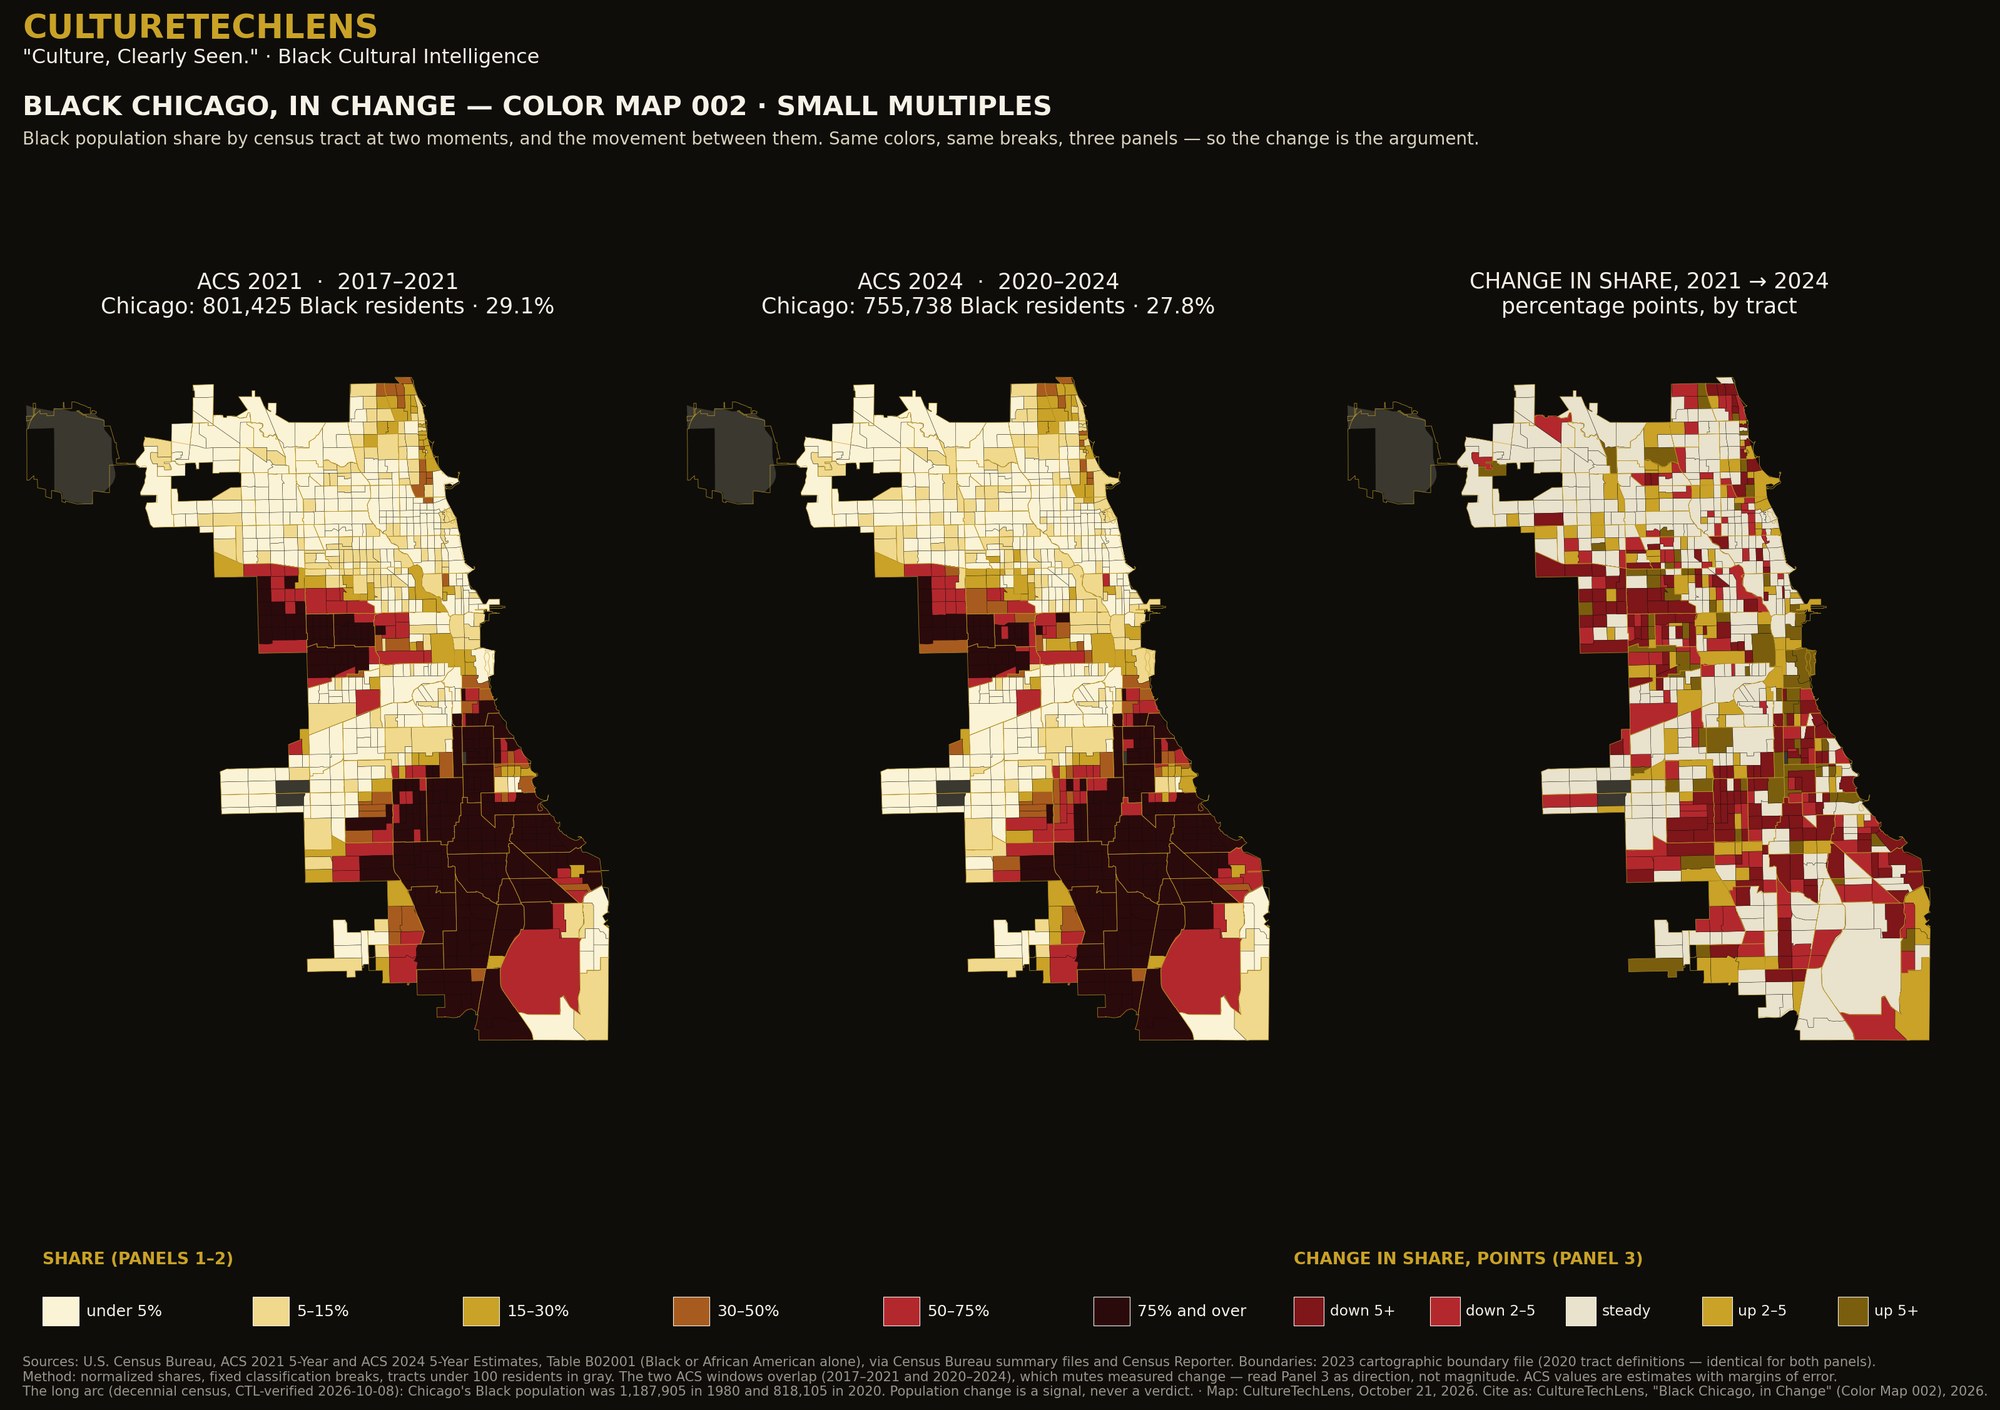
What it documents: Black Chicago, ACS 2021 against ACS 2024 — 29.1% to 27.8%
Data: ACS 2021 vs ACS 2024 small multiples plus a tract-level change panel, on identical 2020 tract boundaries: Black Chicago 801,425 (29.1%) → 755,738 (27.8%).
Definition: Black alone (U.S. Census Bureau, American Community Survey).
Verification: The two ACS windows overlap (2017–2021 vs 2020–2024), so the panels show direction, not exact magnitude — printed on the figure itself.
How to read it: Read the change panel as direction of travel at tract level, not as a precise count of who moved; the overlapping survey windows are why the set says so on its face.
Part of “Black Chicago in Color — The Three-Map Briefing Set” (CultureTechLens, October 22, 2026), the first published product of the Black Chicago Cultural Atlas (CTL-RA-CHI-000001). Companion reading: the set’s executive brief tells the story the three maps tell together, and its Young Readers companion carries the same facts in plain language — both are delivered with the licensed package.
The briefing set as a research package: print-resolution figures and the tract-level data behind every color (one row per tract: shares and counts) are delivered as “Black Chicago in Color,” a citation-licensed research package for one institution ($750, ratified). Institutions order through Research or [email protected]. A Map Sprint — the same method cut to your own geography — is scoped at $1,500.
Source: CultureTechLens