 CULTURETECHLENS
THE OTHER SIDE · THE RECORD SAYS
27.8%, Explained: The Map Is the Story
Chicago is 27.8% Black. That number is true — and by itself, it misleads.
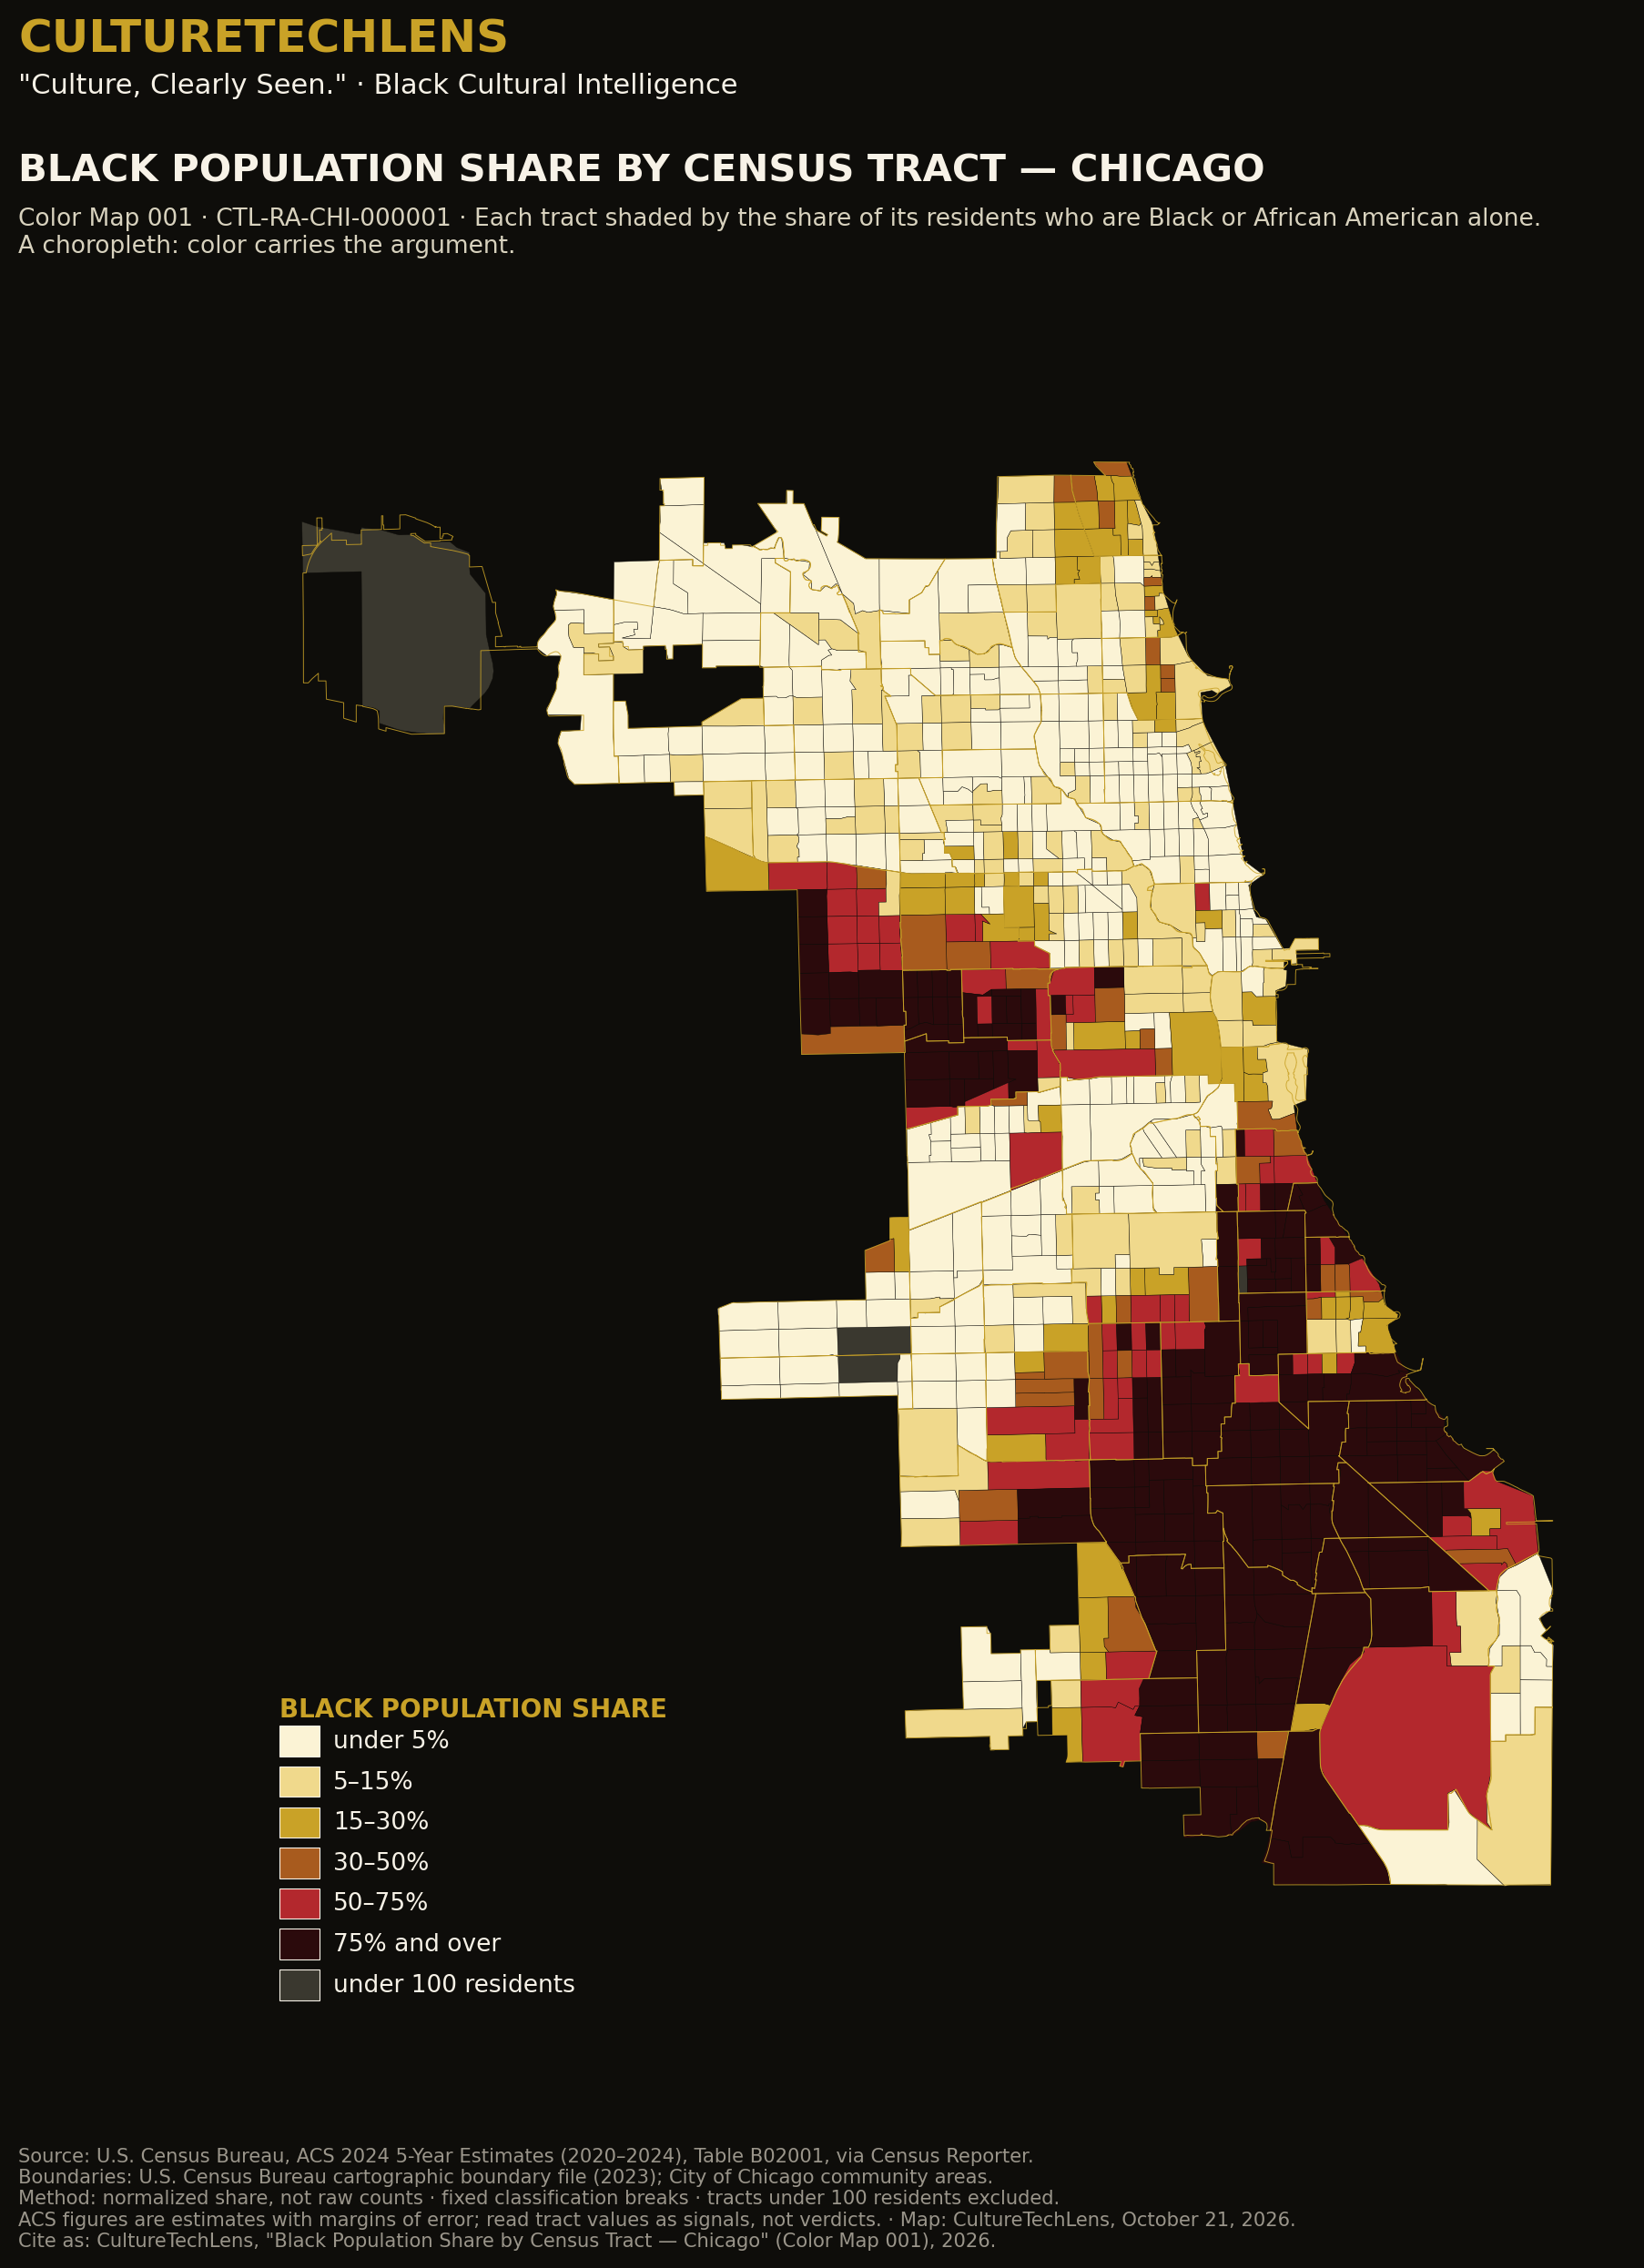
The Census Bureau counts 2,719,960 people in Chicago, and 755,738 of them are Black — 27.8% of the city (American Community Survey 2024 5-Year, Table B02001, across 791 census tracts).
Now look at the map.
The median Chicago tract is only 10.2% Black — less than half the citywide share. 191 tracts are 75% Black or more, home to 460,048 Black Chicagoans. 76.6% of Black Chicago — 579,160 people — lives in tracts that are at least half Black. And 293 tracts are under 5% Black.
Two Chicagos share one average. The map, not the mean, is the honest picture.
Every figure here was recomputed from the tract file itself — not copied from a summary — and reconciled two independent ways before publication. Population is a signal, never a verdict.
In plain words
About 28 of every 100 Chicagoans are Black. But Black Chicago is not spread evenly — most Black Chicagoans live in neighborhoods that are mostly Black, and many neighborhoods have almost no Black residents. The map shows what the single number hides.
Read the full, citable edition — with the tract data file and complete citations → · The three-map briefing set is a Research Desk commission.
Sources
- U.S. Census Bureau, American Community Survey 2024 5-Year Estimates, Table B02001, via the Census Bureau API (verified October 22, 2026), as published in CultureTechLens Color Map 001 (B-01).
- CultureTechLens, “27.8% — The Chicago the Census Counts” (B-01) — the authoritative edition this story stands on.
Cite as: CultureTechLens, “27.8%, Explained: The Map Is the Story,” October 26, 2026. Source: CultureTechLens · “Culture, Clearly Seen.”