 CULTURETECHLENS
Photo: TonyTheTiger, CC BY-SA 3.0, via Wikimedia Commons
The Pay Gap, Explained: 4.8 to 1
The Pay Gap, Explained: 4.8 to 1 — part of CultureTechLens’s Black Culture in Data series.
In 2024, the best-paid player in the WNBA earned $241,984. That is the supermax — the absolute ceiling of what the league's collective bargaining agreement allowed any woman to make. The same season, the NBA's rookie minimum — the floor, the number paid to an undrafted kid who might never play a minute — was $1,157,153.
Read that again. The floor of one league was 4.8 times the ceiling of the other.
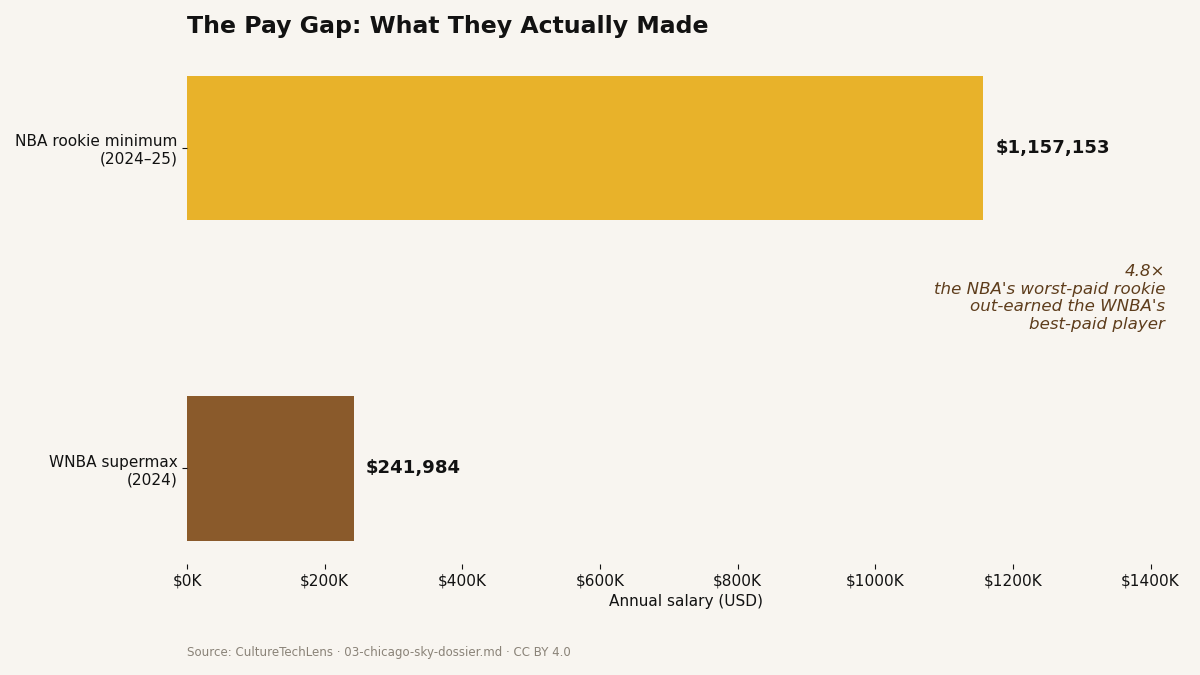
This is not a debate about effort or skill. The NBA's average salary that season was $11.8 million. The WNBA's team salary cap — the total for an entire roster of twelve — was $1,463,200. The whole Chicago Sky, championship banners and all, cost less than one mid-level NBA bench player.
The numbers are the argument. And the numbers are why everything else in this series exists: the charter flights, the media deals, the expansion fees, the new CBA. Every one of those stories is a story about what happens when a league built on Black women's labor finally gets priced like it matters.
Where the gap came from
The gap is not an accident. It is the product of thirty years of deliberate underinvestment dressed up as market logic. The WNBA was founded in 1996 as a summer league subsidiary of the NBA, and it was capitalized like one — small budgets, small marketing, small ambition. The players were told the league couldn't afford more, and for a long time the league's books agreed.
But here is the thing the dossier keeps circling: the "market" that supposedly couldn't pay women was never allowed to find out what it could pay. The league's media deal before 2024 was worth roughly $43 million a year. Then the new deal landed at roughly $200 million a year, and then $281 million. The market didn't gradually discover women's basketball. It woke up all at once, because the audience had been there for years and the infrastructure finally caught up.
What the new CBA changes
The 2026 collective bargaining agreement, ratified in March 2026, is the first time the pay structure reflects anything close to the new reality. The salary cap goes from $1.46 million to $7 million. The supermax goes from $241,984 to $1.4 million. The minimum goes from $76,535 to $270,000. Players get roughly 20 percent of gross revenue, up from about 9 percent.
These are real numbers — the first million-dollar salaries in league history. A'ja Wilson, Kelsey Mitchell, and Napheesa Collier signed $1.4 million supermaxes. The number-one draft pick's rookie deal went from $78,831 to $500,000.
But keep the chart in your head. Even the new supermax — $1.4 million — is barely above the old NBA rookie minimum. The gap closed. It did not close all the way. The question was never whether women deserved NBA money. The question was whether the league would ever be allowed to pay what its own market now supports.
Why this number matters
William's lane is called "The Black Athletic Record," and its flagship question is: What did they actually do — and what did it cost them? The pay gap is the cost, stated in dollars. Every overseas flight, every second job, every Thanksgiving missed — the double shift that defined two generations of players — traces back to this chart.
The 4.8-to-1 ratio is the single most damning number in the dossier. It is also, finally, a historical artifact. The new CBA doesn't erase it. It answers it.
This article is part of CultureTechLens's "Black Culture in Data" series, drawing on the research dossier "The Chicago Sky and the Economics of the WNBA" (Sports Lane 03). Every figure is evidence-graded in the dossier; all dollar figures are dated to their reporting.
The complete chart set is published with this article as part of CultureTechLens’s Black Athletic Record research program.
Companion: a shorter version of this explainer appears on the CultureTechLens blog, our companion editorial channel. Per CTL-PUB-001 (our companion-publishing rule), this page is the authoritative, citable record.
Source: CultureTechLens
From the Archive
The archive in pictures
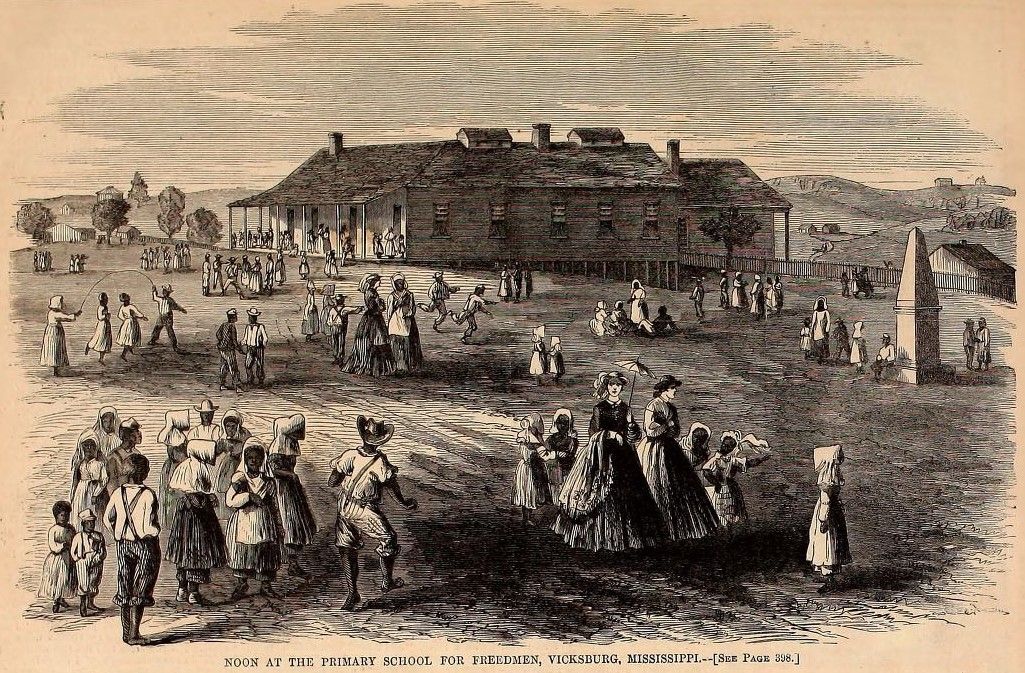
Where the learning happened — and who kept it. Photographs from the CultureTechLens research record — rights-cleared, credited, and cited like everything else here.


Trust & evidence
Evidence before authority. CultureTechLens publishes its methods, its limits, and its corrections alongside its findings. Claims carry grades — VERIFIED, SUPPORTED, PROVISIONAL, DISPUTED, UNRESOLVED — and unknowns are never reported as zero.
Every claim graded. Every source named. Every correction public — see the corrections log.